
Figures & data
Table 1 Detailed information of the subjects in this study
Figure 1 (A) The scanning electron microscopy images of the gold nanoparticles. (B) The UV–visible absorption of the gold nanoparticles and the gold nanoparticles with serum. (C) SERS spectrum of serum, regular Raman spectrum of serum, and Raman spectrum of the gold nanoparticles. (D) Enlarged figure of regular Raman spectrum of serum. (E) Enlarged figure of Raman spectrum of the gold nanoparticles.
Abbreviations: Abs, absorbance; au, arbitrary unit; SERS, surface-enhanced Raman spectroscopy; SE (U), secondary electron (U); UV, ultraviolet.
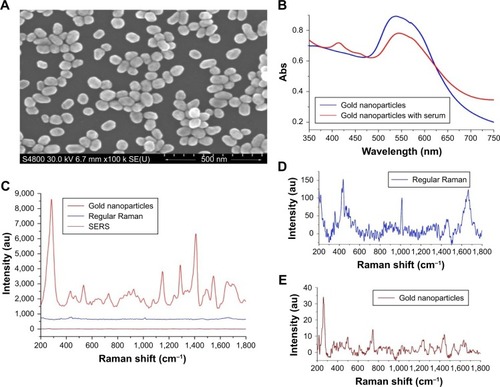
Table 2 The assignments of the different peaks in the Raman spectra
Table 3 The results of the classification of different T stage groups
Figure 2 (A) The normalized average SERS spectra of the T1, T2, T3, and T4 groups. (B) The two-dimensional scatter plot diagram of the T1, T2, T3, and T4 groups. (C) The normalized average SERS spectra of T1–2 and T3–4, and the subtracted spectrum of T1–2 and T3–4. (D) The histogram of discrimination scores of T1–2 and T3–4.
Abbreviation: SERS, surface-enhanced Raman spectroscopy.
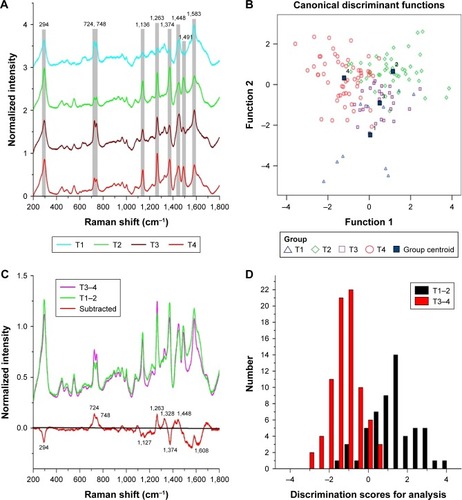
Table 4 The results of the classification of T1–2 and T3–4 stage groups
Figure 3 (A) The normalized average SERS spectra of N0, N1, and N2 groups and the subtracted spectra of different N groups. (B) The two-dimensional scatter plot diagram of the N0, N1, and N2 groups.
Abbreviations: au, arbitrary unit; SERS, surface-enhanced Raman spectroscopy.
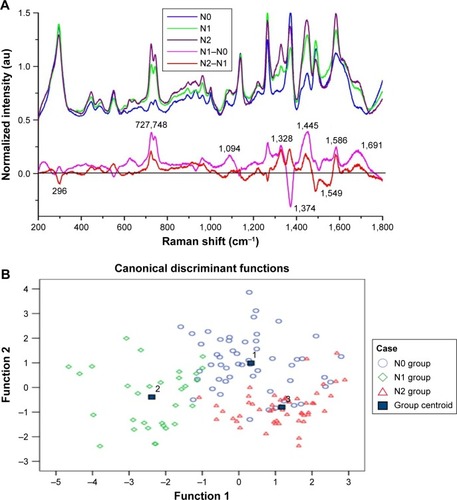
Table 5 The results of the classification of different N stage groups
Figure 4 (A) The normalized average SERS spectra of the SCC-I, SCC-II, and the SCC-III groups and the subtracted spectra of different SCC groups. (B) The two-dimensional scatter plot diagram of the SCC-I, SCC-II, and the SCC-III groups.
Abbreviations: SCC, squamous cell carcinoma; SERS, surface-enhanced Raman spectroscopy.
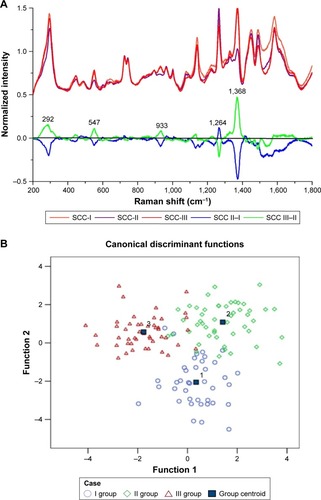
Table 6 The results of the classification of different histologic grade groups