Figures & data
Table 1 The best formulation of solid lipid nanoparticles when the percentage of solid lipid changes
Table 2 The best formulation of solid lipid nanoparticles when the percentage of surfactant changes
Table 3 The best formulations of solid lipid nanoparticles (SLNs) with suitable stability and particle size
Table 4 Ingredients used in formulation of simple cream and cream containing solid lipid nanoparticles
Figure 1 Transmission electron microscopy photograph of a Q10-loaded solid lipid nanoparticle.
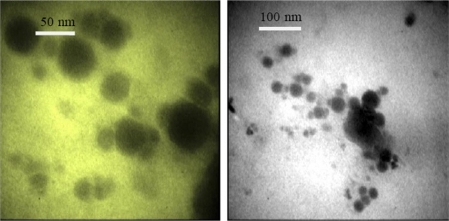
Figure 2 Elevation of lipid content in formulation increases the particle size.
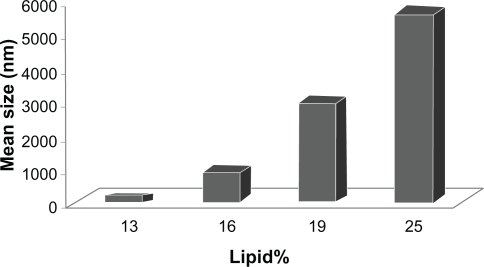
Figure 3 Differential scanning calorimetry thermogram of sample A (stearic acid), sample B (coenzyme Q10), sample C (solid lipid nanoparticle), and sample D (Q10-loaded solid lipid nanoparticle).
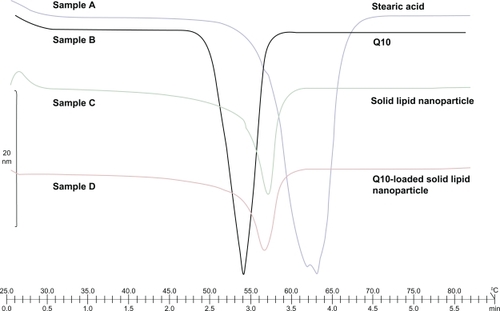
Figure 4 Concentration of released Q10 versus time for simple Q10, solid lipid nanoparticle (SLN), and Q10-loaded SLN cream.
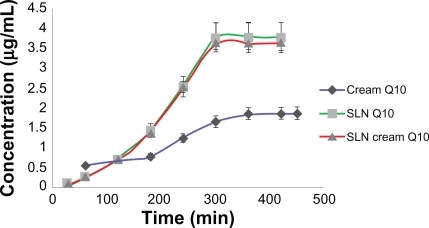
Figure 5 Percentage of released Q10 versus time for simple Q10, solid lipid nanoparticle (SLN), and Q10-loaded SLN cream.
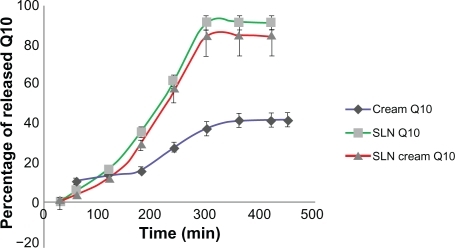
Figure 6 Percentage of increase in hydration for simple cream and solid lipid nanoparticle (SLN) cream containing Q10 after 1- and 2-month application periods. All results are expressed as values related to the measured values on day 0 and the untreated control (mean ± standard deviation, n = 25; P < 0.05).
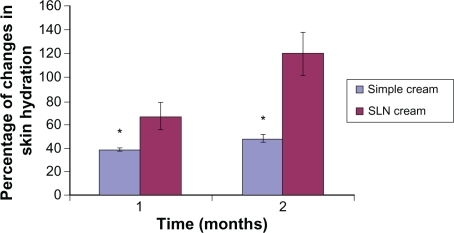
Figure 7 Percentage of increase in elasticity for simple and solid lipid nanoparticle (SLN) cream containing Q10 after 1- and 2-month application periods. All results are expressed as values related to the measured values on day 0 and the untreated control (mean ± standard deviation, n = 25; P < 0.05).
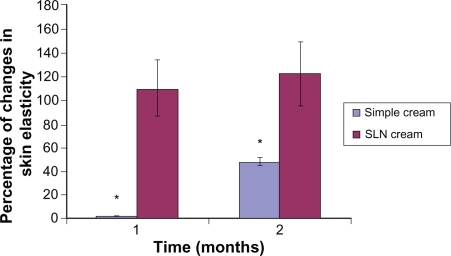
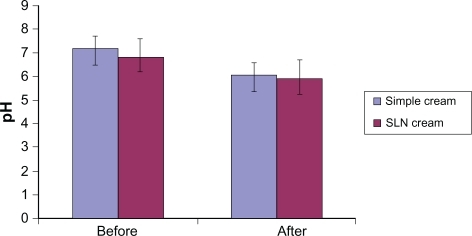
Figure 8 Changes in skin pH after using solid lipid nanoparticle (SLN) cream and simple cream (mean ± standard deviation, n = 25; P < 0.05).