Figures & data
Figure 1 (A) The TEM image of GQDs. Inset: a typical single GQD with a lattice spacing of 0.22 nm. (B) The size distribution of GQDs calculated from 200 dots. (C) AFM image of GQDs. Inset: the height distribution of the GQDs calculated from 100 dots as shown in the AFM image. (D) XRD pattern of trisodium citrate and GQDs.
Abbreviations: TEM, transmission electron microscopy; GQDs, graphene quantum dots; AFM, atomic force microscopy; XRD, X-ray diffraction.
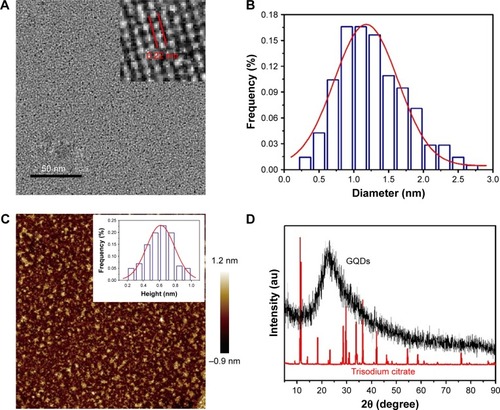
Figure 2 (A) XPS survey spectrum of the GQDs. (B) XPS high-resolution spectrum of C1s core levels in the GQDs. (C) XPS high-resolution spectrum of O1s core levels in the GQDs. (D) FTIR spectrum of the GQDs.
Abbreviations: XPS, X-ray photoelectron spectroscopy; GQD, graphene quantum dots; FTIR, Fourier transform infrared spectroscopy.
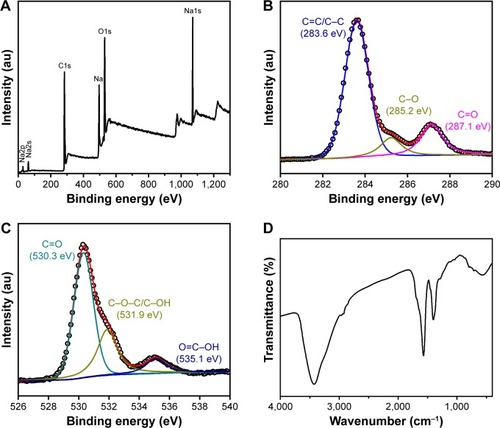
Figure 3 (A) PL and PLE spectra of the GQDs. The insert shows the photographs of the GQDs aqueous solution under visible light and 302 nm UV light. (B) PL decay curve at 420 nm for the GQDs.
Abbreviations: PL, photoluminescence; PLE, photoluminescence excitation; GQDs, graphene quantum dots.
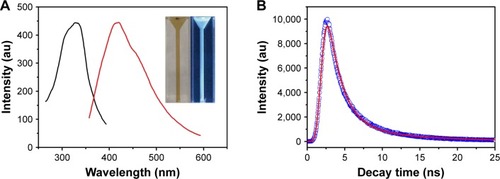
Figure 4 (A) Effect of ion strength on the fluorescence intensity of GQDs. (B) Effect of pH value on the fluorescence intensity of GQDs. (C) Effect of temperature on the fluorescence intensity of GQDs. (D) Long-term stability of GQDs at room temperature. (E) Fluorescence photostability of GQDs. (F) Effect of hydrogen peroxide on the fluorescence intensity of GQDs.
Abbreviations: PL, photoluminescence; GQDs, graphene quantum dots.
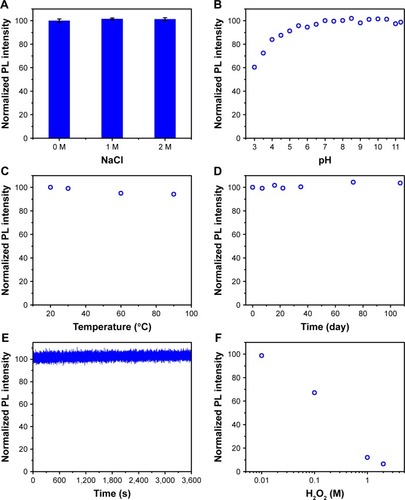
Figure 5 Cell viability of HeLa cancer cells after incubation with GQDs at different concentrations after 24 hours.
Abbreviation: GQDs, graphene quantum dots.
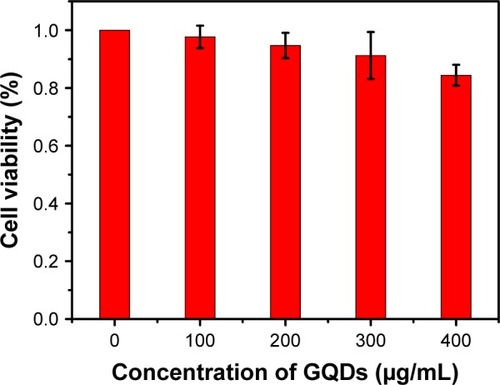
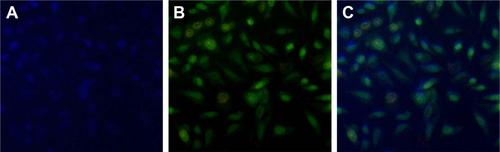
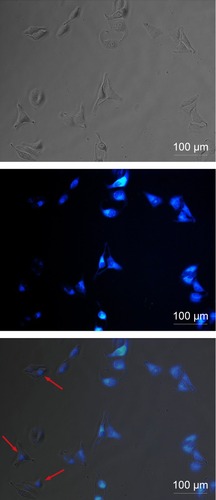
Figure 6 Microscopy images of HeLa cells after incubation with GQDs for 2 hours (from left to right, bright-field image, fluorescence image, and merged image). As indicated by the red arrows, the GQDs can penetrate into the nuclei.
Abbreviation: GQDs, graphene quantum dots.
Scheme 1 Processing diagram for the preparation of photoluminescent GQDs.
Abbreviation: GQDs, graphene quantum dots.
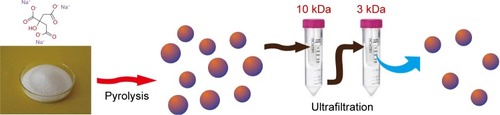
Figure S1 Fluorescence emission spectra of GQDs with different excitation wavelength.
Abbreviation: GQDs, graphene quantum dots.
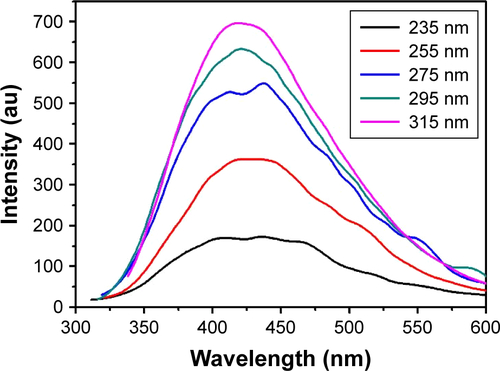
Figure S2 Fluorescent images of HeLa cells (A) after treatment with GQDs; (B) after staining with AO/EB dyes. (C) Merged image of (A and B).
Abbreviations: GQDs, graphene quantum dots; AO/EB, acridine orange/ethidium bromide.