Figures & data
Table S1 T1 and T2 relaxation time of the Fe3O4@mSiO2/PDDA/BSA-Gd2O3 nanocomplex prepared with different concentrations of Fe3O4 nanoparticles (n=4)
Table S2 T1 and T2 relaxation time of the mSiO2/PDDA/BSA-Gd2O3 nanocomplex, Fe3O4@mSiO2/PDDA/BSA-Gd2O3 nanocomplex and Fe3O4@mSiO2 nanocomplex (n=4)
Table S3 T1 relaxation time of NIH-3T3 mouse fibroblast cells and 786-0 renal carcinoma cells treated with 1 mg mL−1 Fe3O4@mSiO2/PDDA/BSA-Gd2O3 nanocomplex (−) and Fe3O4@mSiO2/PDDA/BSA-Gd2O3-AS1411 nanoprobe (+) (n=4)
Table S4 T2 relaxation time of NIH-3T3 mouse fibroblast cells and 786-0 renal carcinoma cells treated with 1 mg mL−1 Fe3O4@mSiO2/PDDA/BSA-Gd2O3 nanocomplex (−) and Fe3O4@mSiO2/PDDA/BSA-Gd2O3-AS1411 nanoprobe (+) (n=4)
Figure 1 Characterization of the assembly process of Fe3O4@mSiO2/PDDA/BSA-Gd2O3 with zeta potential (A), hydrodynamic diameter determination (B), and the fabrication of the Fe3O4@mSiO2/PDDA/BSA-Gd2O3-AS1411 nanoprobe with fourier transform infrared absorption (FTIR) spectra (C) and UV-vis spectra (D).
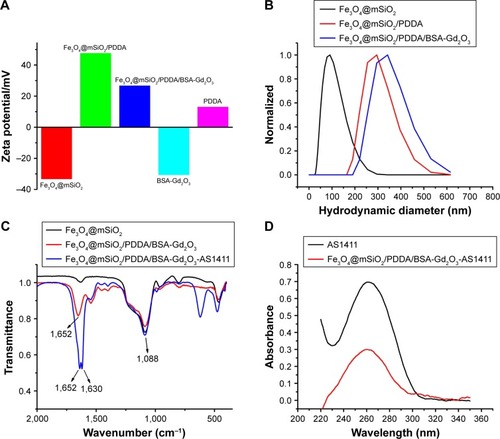
Figure 2 T1-weighted magnetic resonance (MR) images and T1-map images as well as T2-weighted MR images and T2-map images of the Fe3O4@mSiO2/PDDA/BSA-Gd2O3 nanocomplex prepared with different concentrations of BSA-Gd2O3 NPs. 3.0 T human magnetic resonance scanner was used.
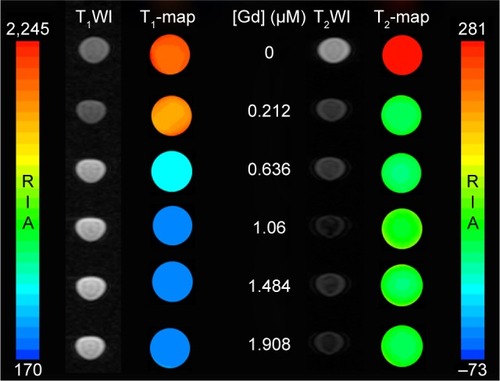
Figure 3 T1 and T2 relaxation time of the Fe3O4@mSiO2/PDDA/BSA-Gd2O3 nanocomplex prepared with different concentrations of BSA-Gd2O3 NPs. BSA-Gd2O3 NPs (0 µM) were treated as the control group, and other groups were all compared with the control group with one-way ANOVA. *Refers to statistically significant differences compared with the control group with one-way ANOVA (p<0.05). #Refers to statistically significant differences compared with control group with one-way ANOVA (p<0.05). A 3.0 T human magnetic resonance scanner was used.
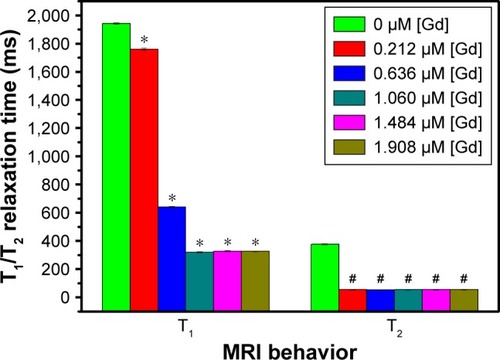
Figure 4 T1 relaxivity curves (A) and T1-weighted magnetic resonance (MR) images (B) of Gd-DTPA (1), BSA-Gd2O3 NPs (2), and Fe3O4@mSiO2/PDDA/BSA-Gd2O3 nanocomplex (3) with various Gd concentrations. A 3.0 T human MR scanner was used.
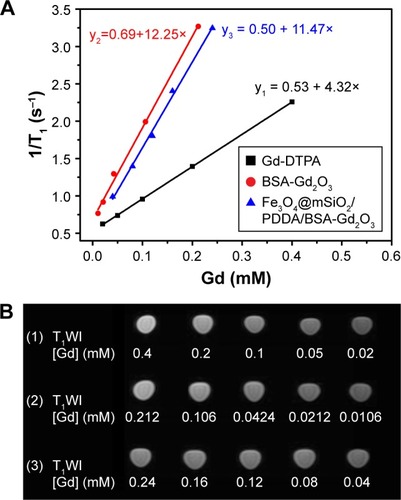
Figure 5 T2 relaxivity curves and T2-weighted magnetic resonance (MR) images of the Fe3O4 (A), and Fe3O4@mSiO2/PDDA/BSA-Gd2O3 nanocomplex (B) with various Fe3O4 nanoparticle concentrations. A 3.0 T human MR scanner was used.
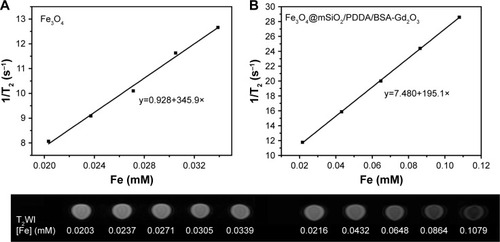
Figure 6 Cell viability of 786-0 renal carcinoma cells and NIH-3T3 mouse fibroblast cells after exposure to various concentrations of the Fe3O4@mSiO2/PDDA/BSA-Gd2O3 nanocomplex, determined by 3-(4,5-Dimethylthiazol-2-yl)-2,5-diphenyltetrazolium bromide (MTT) assay.
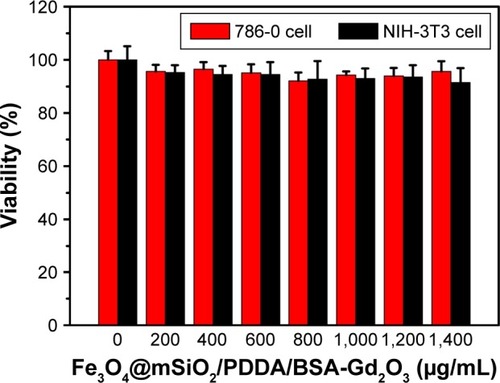
Figure 7 Iron and gadolinium ions released from the Fe3O4@mSiO2/PDDA/BSA-Gd2O3 nanocomplex in cell culture medium over time (A) and in different pH solutions incubated for 24 h (B).
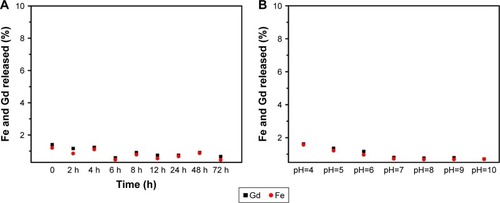
Figure 8 T1-weighted magnetic resonance (MR) images and T1-map images (A) as well as T2-weighted MR images and T2-map images (B) of 786-0 renal carcinoma cells treated with different concentrations of the Fe3O4@mSiO2/PDDA/BSA-Gd2O3 nanocomplex (−) and Fe3O4@mSiO2/PDDA/BSA-Gd2O3-AS1411 nanoprobe (+) (0, 0.5, 1, 2.5 mg/mL−1). A 3.0 T human MR scanner was used.
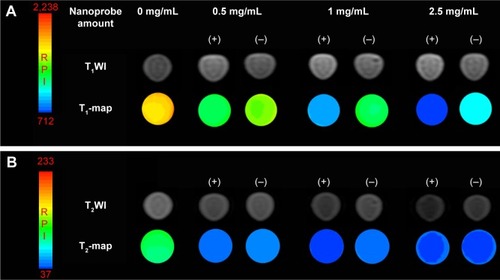
Figure 9 T1 (A) and T2 relaxation time (B) of 786-0 renal carcinoma cells treated with different concentrations of the Fe3O4@mSiO2/PDDA/BSA-Gd2O3 nanocomplex (−) and Fe3O4@mSiO2/PDDA/BSA-Gd2O3-AS1411 nanoprobe (+).
Notes: *Refers to statistically significant differences compared with the control group using one-way ANOVA (p<0.05). #Refers to statistically significant differences compared with the control group with one-way ANOVA (p<0.05). aRefers to statistically significant differences within group with LSD Duncan (p<0.05). bRefers to statistically significant differences within group with LSD Duncan (p<0.05). cRefers to statistically significant differences within group with LSD Duncan (p<0.05). dRefers to statistically significant differences within group with LSD Duncan (p<0.05). A 3.0 T human magnetic resonance scanner was used.
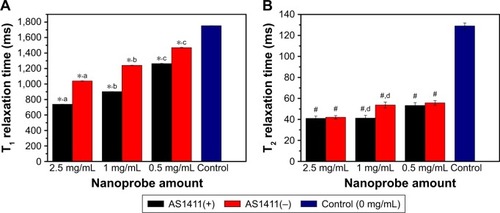
Figure 10 The concentrations of Gd in the heart, lung, liver, and kidney at 1 h and 24 h post-intravenous injection of the Fe3O4@mSiO2/PDDA/BSA-Gd2O3 nanocomplex as determined by inductively coupled plasma-mass spectrometry (n=3, *p<0.05, **p<0.01).
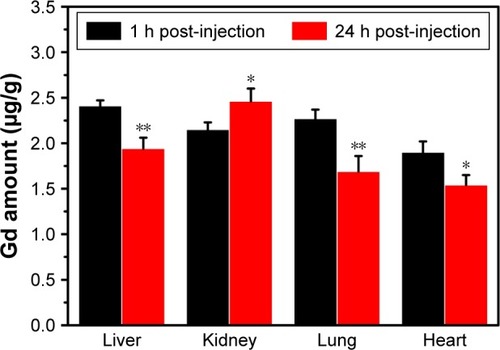
Figure 11 Hematologic analysis of mice at 1 week post-injection of normal saline (black bar) and the Fe3O4@mSiO2/PDDA/BSA-Gd2O3 nanocomplex (red bar).
Notes: (A) White blood cells (WBC), (B) red blood cells (RBC), (C) platelets (PLT), (D) mean corpuscular volume (MCV), (E) hemoglobin (HGB), (F) mean corpuscular hemoglobin concentration (MCHC), (G) mean corpuscular hemoglobin (MCH), and (H) hematocrit (HCT) levels in the blood. ***Refers to statistically significant differences compared with the normal saline group (p<0.001, n=3).
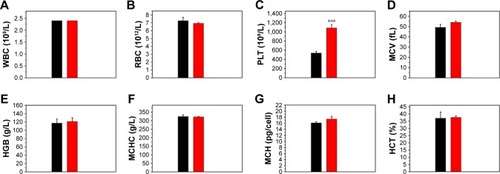
Figure 12 Biochemical analysis of mice at 1 week post-injection of normal saline (black bar) and the Fe3O4@mSiO2/PDDA/BSA-Gd2O3 nanocomplex (red bar).
Notes: (A) Alanine transaminase (AST), (B) aspartate transaminase (ALT), (C) total protein (TP), (D) albumin (ALB), (E) total bilirubin (TBIL), (F) blood urea nitrogen (BUN), and (G) creatinine (CREA) levels in the blood; (n=3).
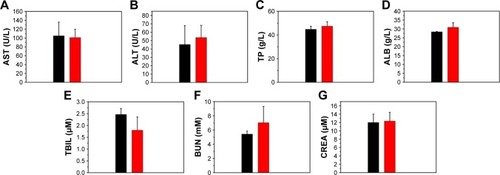
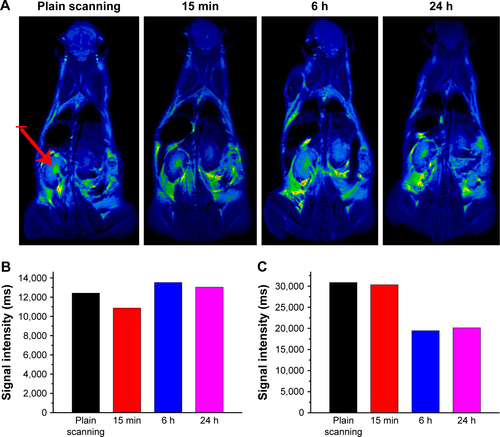
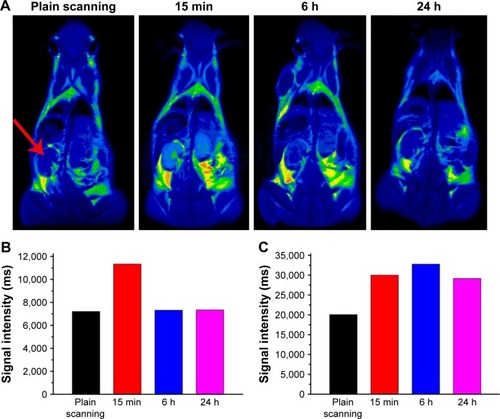
Figure 13 (A) T1-weighted in vivo magnetic resonance imaging (MRI) images of mice post-injection of the Fe3O4@mSiO2/PDDA/BSA-Gd2O3 nanocomplex at different time points (0, 15 min, 6 h, and 24 h). The signal intensities in the kidneys (B) and bladder (C) at different time points after intravenous injection of the Fe3O4@mSiO2/PDDA/BSA-Gd2O3 nanocomplex. The red arrow indicates the kidney.
Scheme 1 Schematic illustration of the fabrication process of the Fe3O4@mSiO2/PDDA/BSA-Gd2O3-AS1411 nanoprobes.
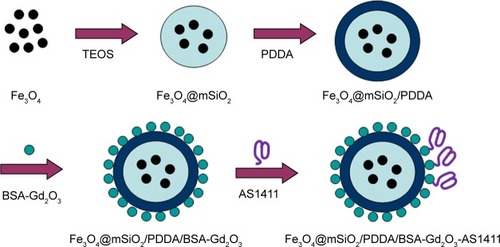
Figure S1 Transmission electron microscopy characterizations of Fe3O4 nanoparticles (NPs) (A) and Fe3O4@mSiO2 NPs (B). The insert in (A) is the distribution of Fe3O4 NP size.
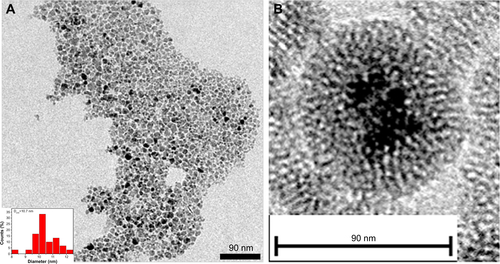
Figure S2 X-ray powder diffraction patterns of the Fe3O4, Fe3O4@mSiO2 and Fe3O4@mSiO2/PDDA/BSA-Gd2O3 nanocomplex.
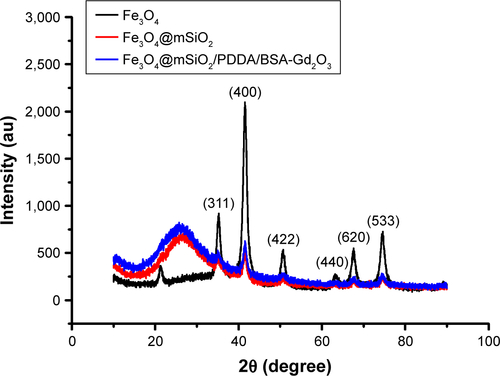
Figure S3 T1-weighted magnetic resonance (MR) images and T1-map images as well as T2-weighted MR images and T2-map images of the Fe3O4@mSiO2/PDDA/BSA-Gd2O3 nanocomplex prepared with different concentrations of Fe3O4 nanoparticles. A 3.0 T human MR scanner was used.
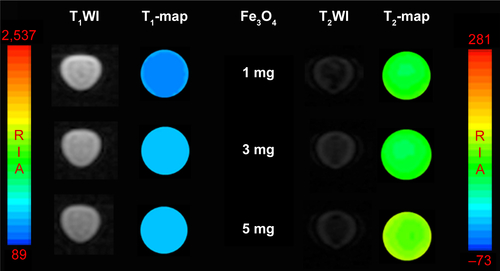
Figure S4 T1-weighted magnetic resonance (MR) images as well as T2-weighted MR images of the mSiO2/PDDA/BSA-Gd2O3 nanocomplex, Fe3O4@mSiO2/PDDA/BSA-Gd2O3 nanocomplex, and Fe3O4@mSiO2 nanocomplex. A 3.0 T human MR scanner was used.
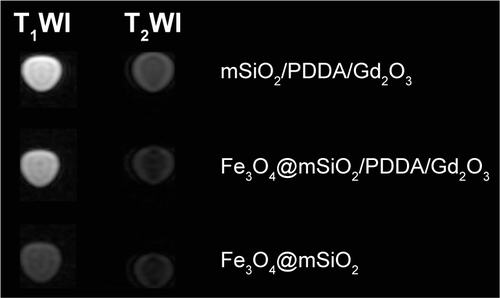
Figure S5 T1-weighted magnetic resonance (MR) images and T1-map images as well as T2-weighted MR images and a T2-map images of the Fe3O4@mSiO2/PDDA/BSA-Gd2O3 nanocomplex and Fe3O4@mSiO2/PDDA/BSA-Gd2O3-AS1411 nanoprobe. No significant difference of T1 and T2 relaxation time could be observed after the AS1411 aptamer modification. A 3.0 T human MR scanner was used.
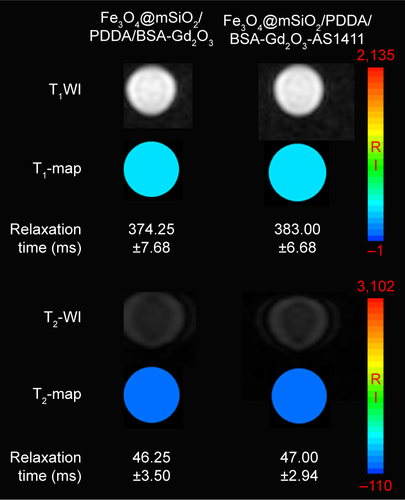
Figure S6 T1-weighted magnetic resonance (MR) images and T1-map images (A) as well as T2-weighted MR images and T2-map images (B) of NIH-3T3 cells treated with 1 mg mL−1 Fe3O4@mSiO2/PDDA/BSA-Gd2O3 nanocomplex (−) and Fe3O4@mSiO2/PDDA/BSA-Gd2O3-AS1411 nanoprobe (+). A 3.0 T human MR scanner was used.
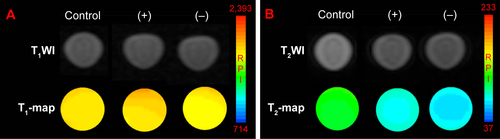
Figure S7 (A) T2-weighted in vivo magnetic resonance imaging (MRI) images of mice post-injection of the Fe3O4@mSiO2/PDDA/BSA-Gd2O3 nanocomplex at different time points (0, 15 min, 6 h, and 24 h). The signal intensities in the kidneys (B) and bladder (C) at different time points after intravenous injection of the Fe3O4@mSiO2/PDDA/BSA-Gd2O3 nanocomplex. The red arrow indicates the kidney.