
Figures & data
Table 1 Parameters of non-labeled and fluorescently labeled gelatin nanospheres in swollen state in different solutions
Figure 1 Scanning electronic micrograph of dehydrated gelatin nanospheres without (A) and with (B) fluorescent labeling. Scale bars represent 500 nm.
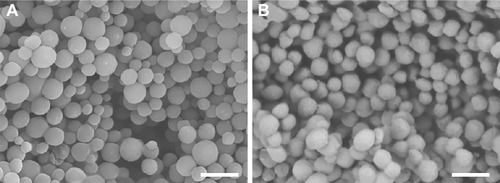
Figure 2 Distribution of zebrafish macrophages and gelatin nanospheres at 3 hours after intravenous injection of gelatin nanospheres into a 3-day-old zebrafish larva. (A) Bright field image; (B) green fluorescent macrophages; (C) red fluorescent gelatin nanospheres; (D) merged image of (B) and (C) with co-localization of gelatin nanospheres and macrophages depicted in yellow. Several macrophages co-localized with gelatin nanospheres in the caudal blood vessel of the larva (blue dashed box in D). Scale bars represent 500 μm. (E) Magnification of the boxed area in (D). Scale bar represents 200 μm.
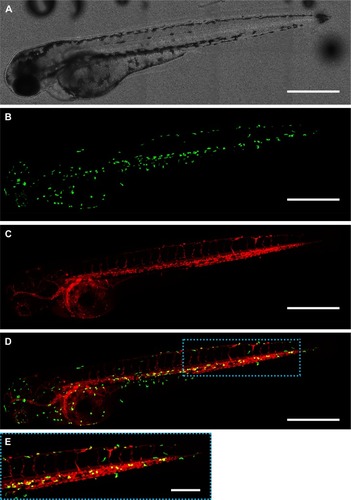
Figure 3 Distribution of zebrafish macrophages and gelatin nanospheres at 24 hours after intravenous injection of gelatin nanospheres into a 3-day-old zebrafish larva. (A) Bright field image; (B) green fluorescent macrophages; (C) red fluorescent gelatin nanospheres; (D) merged image of (B) and (C) with co-localization of gelatin nanospheres and macrophages depicted in yellow. The majority of the observed macrophages co-localized with gelatin nanospheres in the area surrounding the yolk sac of the larva (blue dashed box in D). Scale bars represent 500 μm. (E) Magnification of the boxed area in (D). Scale bar represents 200 μm.
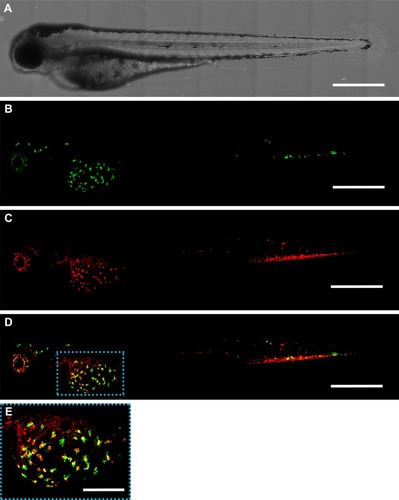
Figure 4 Distribution of zebrafish macrophages and gelatin nanospheres in the muscle tissue surrounding the injection site at 3 hours after intramuscular injection of gelatin nanospheres into a 3-day-old zebrafish larva. (A) Merged overview image with white dashed box indicating the tissue area of injection (injection site indicated by arrow). (B–E) Magnification of the boxed area of (A); (B) depicting the bright field image; (C) green fluorescent macrophages; (D) red fluorescent gelatin nanospheres; (E) merged image of (C) and (D) with co-localization of gelatin nanospheres and macrophages depicted in yellow. Several macrophages co-localized with gelatin nanospheres (E, white dashed box). Scale bar in (A) represents 500 μm and in (B–E) 200 μm.
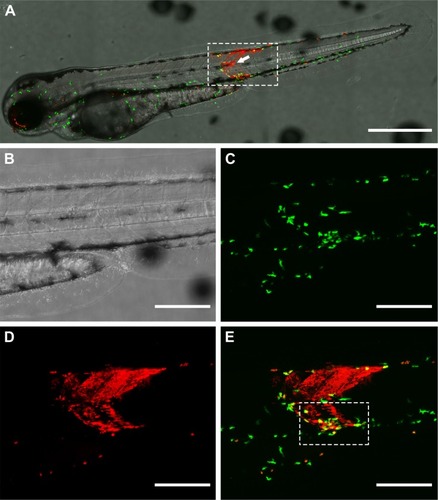
Figure 5 Co-localization of zebrafish macrophages and gelatin nanospheres in the muscle tissue surrounding the injection site at 24 hours after intramuscular injection of gelatin nanospheres into a 3-day-old zebrafish larva. (A) Bright field image; (B) green fluorescent macrophages; (C) red fluorescent gelatin nanospheres; (D) merged image of (B) and (C), with co-localization of macrophages and gelatin nanospheres depicted in yellow. The majority of the injected gelatin nanospheres was confined to the tissue area of injection and engulfed by macrophages, as shown in the merged image (D). Scale bars represent 100 μm.
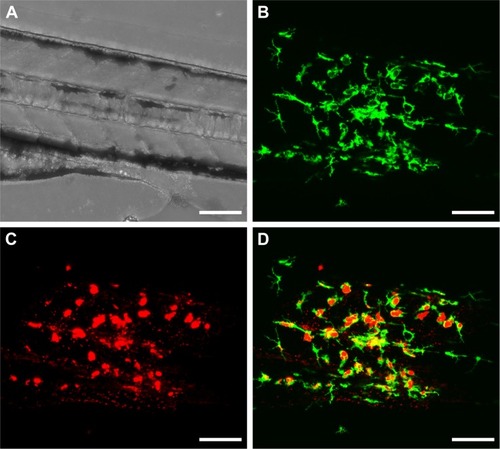
Figure 6 In vitro internalization of fluorescently labeled gelatin nanospheres (GNs, A) and GNs loaded with fluorescent-labeled vancomycin (V-GNs, B) by THP-1-derived macrophages after 24 hours of culture. Cells incubated with free vancomycin without GNs as carriers were used as controls (C). Nucleic acid of the cells was stained with DAPI/blue, and cytoplasm and actin skeleton with Cell-Tracker™ CMFDA/green (in A) and Alexa Fluor® 568 Phalloidin/red (in B and C), respectively. Cell-Tracker™ CMFDA/green also stained nucleic acid of the cells. The fluorescent-labeled GNs were displayed in red (in A) and in cyan (in B). Scale bars represent 20 μm (in A and B) and 10 μm (in C).
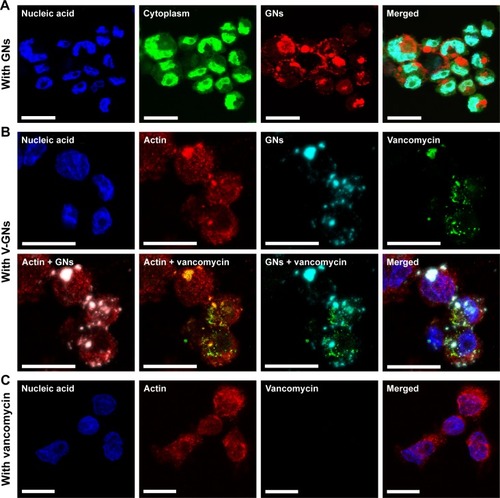
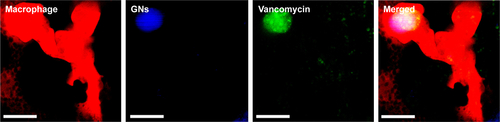
Figure 7 In vivo cellular internalization of fluorescently labeled gelatin nanospheres (GNs, blue) and fluorescent-labeled vancomycin (green) by fluorescent zebrafish macrophages (red) at 24 hours after intramuscular injection of vancomycin-loaded GNs into a 1-day-old zebrafish larva. (A) Interactions between zebrafish macrophages and vancomycin-loaded GNs observed in the muscle tissue surrounding the injection site. The white arrows point at vacuole-like structures of macrophages containing internalized gelatin nanospheres and vancomycin. (B) High magnification of a zebrafish macrophage containing the internalized gelatin nanospheres and vancomycin. Scale bars in A and B represent 50 and 10 μm, respectively.
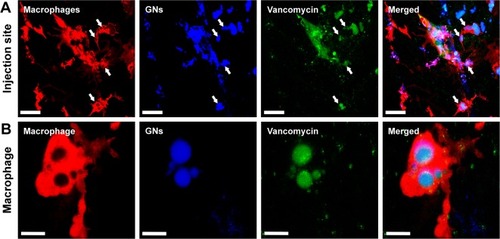
Figure 8 Co-localization of green fluorescent zebrafish macrophages (green) and red fluorescent S. aureus at 2 hours after intravenous injection of bacteria into a 1-day-old zebrafish larva. The median dose of S. aureus assessed directly after injection in 6 control larvae was 3,000 CFU/larva. (A) Merged overview image; (B) distribution of the fluorescent macrophages and injected S. aureus; white dashed boxes indicate the areas of the recorded co-localization enlarged in C and D; (C and D) high magnification of the recorded co-localization, indicated by arrows. Scale bars in A–B and C–D represent 500 and 100 μm, respectively.
Abbreviation: CFU, colony-forming unit.
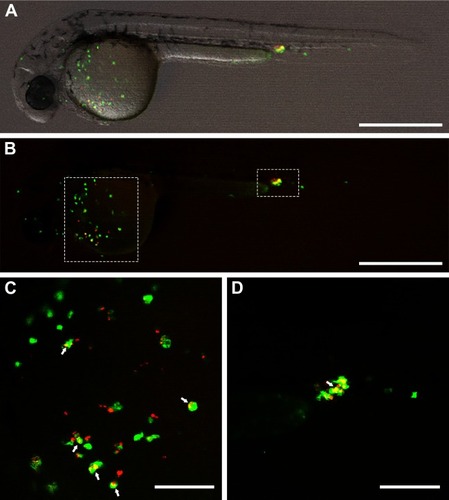
Figure 9 Percent survival (%) of S. aureus-infected zebrafish larvae receiving different treatments, monitored from the day of injection until 4 days post-injection. The median dose of S. aureus assessed directly after injection in control larvae was 3,200 CFU per larva. The infected larvae were treated with vancomycin-loaded gelatin nanospheres (V-GNs), free vancomycin, or only gelatin nanospheres (GNs). Injection of Milli-Q water was used as mock treatment. Larvae receiving two injections of Milli-Q water (infection-free) were used as controls for the injection procedure. The group size of infected larvae was between 32 and 35 larvae per group at the start of the experiment. The group size of infection-free larvae was 10 larvae. Survival of zebrafish larvae receiving locally delivered vancomycin (V-GNs) was statistically significantly higher than survival of zebrafish larvae receiving systemically delivered vancomycin (P=0.01).
Abbreviation: CFU, colony-forming unit.
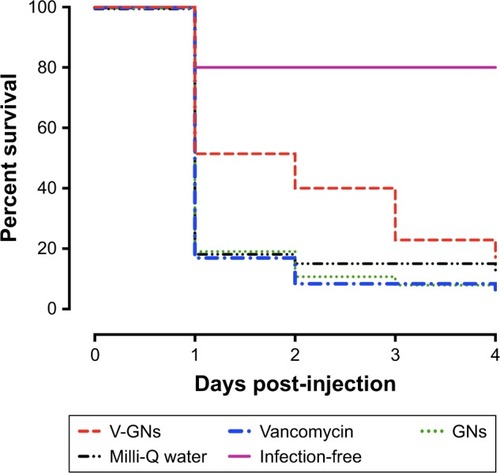
Figure S1 The schematic experimental setup of the present study.
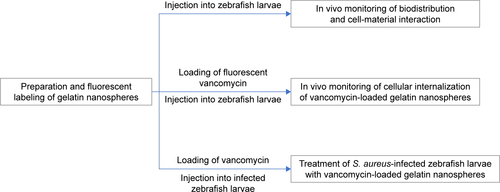
Figure S2 Detection of the Kaede fluorescent protein expressed in zebrafish macrophages at 3 hours post-intramuscular injection of PBS into a 3-day-old transgenic zebrafish larva (mpeg 1: Kaede). The Kaede fluorescent protein may undergo an irreversible photoconversion from green to red fluorescence upon UV illumination (350–400 nm), depending on the exposure time and energy levels. (A) Merged image of the bright field and green channel image; (B) green channel image; (C) red channel image; (D) merged image of (B) and (C). The white dashed boxes indicate the location of the Kaede protein expressing macrophages in the muscle tissue area of injection. After illumination, no red signal was detected in these macrophages in the red channel (C), indicating that no color conversion of Kaede from green to red occurred under the setting used in the present study. Although the pigment cells of these zebrafish embryos show autofluorescence both in green and in red (fluorescence detected outside of the white dashed box in B–D), they mainly lined up at the border of the embryo trunk. They were not motile and not present in the area of injection. Therefore, the autofluorescence of pigment cells did not influence the recording of the macrophage responses in muscle tissue. Scale bars represent 100 μm.
Abbreviations: PBS, phosphate buffered saline; UV, ultra violet.
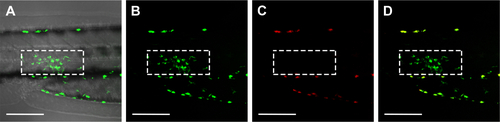
Figure S3 A zebrafish macrophage (red) containing internalized fluorescently labeled gelatin nanospheres (GNs, blue) and fluorescent-labeled vancomycin (green) at 24 hours after intramuscular injection of vancomycin-loaded GNs into a 3-day-old zebrafish larva. Scale bars represent 10 μm.
Video S1 Three-dimensional (3D) video showing the distribution of fluorescently labeled gelatin nanospheres (red) and Kaede fluorescent protein expressing macrophages (green) at 3 hours post-intravenous injection of gelatin nanospheres into a 3-day-old zebrafish larva. Parts of the embryo such as the yolk and head were not entirely shown in this video since the maximum depth of the employed Z-stack was limited. This 3D video was converted from a series of Z-stack images shown in . Scale bar represents 500 μm.
Video S2 Three-dimensional (3D) video showing the distribution of fluorescently labeled gelatin nanospheres (red) and Kaede fluorescent protein expressing macrophages (green) at 24 hours post-intravenous injection of gelatin nanospheres into a 3-day-old zebrafish larva. Co-localization of gelatin nanospheres and macrophages was clearly observed in the area surrounding the yolk of the embryo. Parts of the embryo such as the yolk and head were not entirely shown in this video since the maximum depth of the employed Z-stack was limited. This 3D video was converted from a series of the Z-stack images shown in . Scale bar represents 500 μm.
Video S3 Three-dimensional (3D) video showing the distribution of fluorescently labeled gelatin nanospheres (red) and Kaede fluorescent protein expressing zebrafish macrophages (green) in the muscle tissue of injection at 3 hours post-intramuscular injection of gelatin nanospheres into a 3-day-old zebrafish larva. This video was converted from a series of the Z-stack images shown in . Scale bar represents 200 μm.
Video S4 Three-dimensional (3D) video showing the distribution of fluorescently labeled gelatin nanospheres (red) and Kaede fluorescent protein expressing zebrafish macrophages (green) in the muscle tissue of injection at 24 hours post-intramuscular injection of gelatin nanospheres into a 3-day-old zebrafish larva. The majority of the injected gelatin nanospheres was engulfed by the macrophages. This video was converted from a series of the Z-stack images shown in . Scale bar represents 100 μm.
Video S5 Three-dimensional (3D) video showing the internalization of fluorescently labeled gelatin nanospheres (red) by THP-1 macrophages after 24 hours of culture. The cells appeared turquoise due to the merge of the colors of their nucleic acid which was stained both by DAPI and Cell-Tracker™ CMFDA/green. Their cytoplasm was stained by Cell-Tracker™ CMFDA/green. Scale bar represents 50 μm.
Video S6 Three-dimensional (3D) video showing the internalization of vancomycin-loaded gelatin nanospheres by THP-1 macrophages after 24 hours of culture. The nucleic acid and actin of the cells were stained by DAPI and Alexa Fluor® 594 Phalloidin, respectively. Fluorescent-labeled vancomycin and gelatin nanospheres were shown in green and cyan, respectively. This video was converted from a series of the Z-stack images shown in . Scale bar represents 10 μm.
Video S7 Three-dimensional (3D) video showing the internalization of fluorescent-labeled vancomycin (green) in vacuole-like structures of zebrafish macrophage expressing mCherry fluorescent proteins (red) at 24 hours post-intramuscular injection of vancomycin-loaded gelatin nanospheres into a 3-day-old zebrafish larva. This video was converted from a series of the Z-stack images shown in (B) in , excluding the blue channel images of fluorescently labeled gelatin nanospheres. Scale bars represent 10 μm.
Video S8 Three-dimensional (3D) video showing the internalization of fluorescently labeled gelatin nanospheres (blue) in the vacuole-like structures of the mCherry fluorescent protein (red) expressing zebrafish macrophage as shown in at 24 hours post-intramuscular injection of vancomycin-loaded gelatin nanospheres into a 3-day-old zebrafish larva. This video was converted from a series of the Z-stack images shown in (B) in , excluding the green channel images of fluorescent-labeled vancomycin. Scale bars represent 10 μm.