Figures & data
Figure 1 The laminectomy process in rabbit models.
Note: (A) The arrow indicates spinous process, vertebral lamina, (B) lamina defect with visible spinal dural, and (C) electrospun fibrous membranes were laid on the lamina defect.
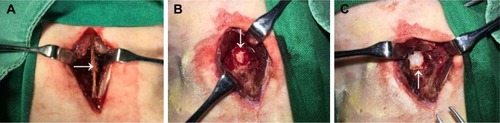
Figure 2 SEM micrographs of electrospun membranes with different magnifications (A and B); diameter and pore size distribution in ICA-loaded PCL–gelatin electrospun membranes (C and D).
Abbreviations: ICA, icariin; PCL, polycaprolactone; SEM, scanning electron microscopy.
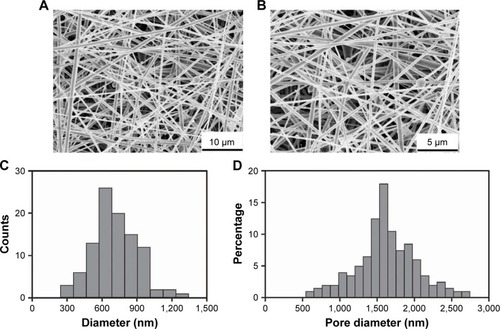
Figure 3 Chemical, thermal and mechanical properties of the ICA-loaded PCL–gelatin membranes: (A) FTIR spectra, (B) DSC thermograms, (C) stress–strain curves and (D) water contact angle.
Abbreviations: DSC, differential scanning calorimetry; ICA, icariin; PCL, polycaprolactone.
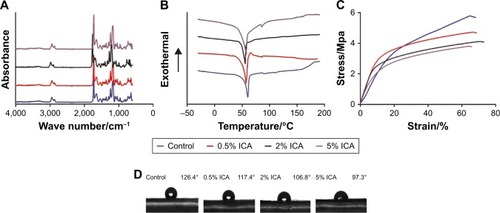
Figure 4 Daily (A) and cumulative (B) release of ICA from PCL–gelatin electrospun membranes after incubation in PBS at 37°C.
Abbreviations: ICA, icariin; PCL, polycaprolactone.
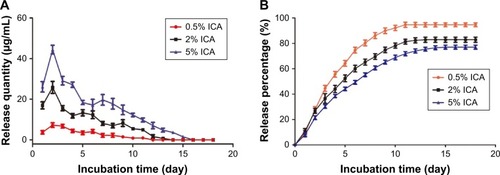
Figure 5 (A) The photographs and the schematic diagram on barrier function of ICA-loaded PCL/gelatin membranes. (B) The bottom of the 24-well plate after seeding cells on the membranes for 7 days. (C) SEM micrograph of the opposite side of the cell-cultured membrane for 7 days.
Abbreviations: ICA, icariin; PCL, polycaprolactone; SEM, scanning electron microscopy.
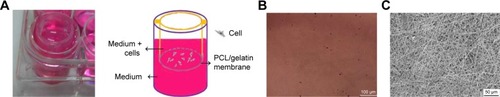
Figure 6 The RGR/% of fibroblast cells cultured in extract solutions of electrospun membranes (A) and dead/live cells staining for 4-day culture (*P<0.05 compared with the control group) (B) by using the AO-EB kit.
Abbreviations: AO-EB, acridine orange–ethidium bromide; d, day; ICA, icariin; RGR, relative growth rate.
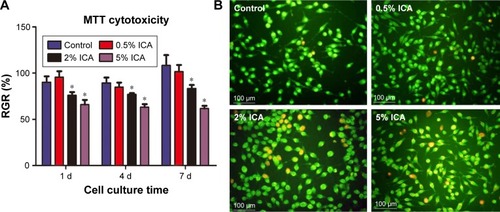
Figure 7 Cell adhesion and proliferation on the surface of different membranes.
Notes: (A) OD of fibroblast cells after 1 day, 4 days and 7 days (*P<0.05 compared with the control group); the SEM micrographs (B) and fluorescent images (C) of cells cultured for 4 days.
Abbreviations: CCK-8, Cell Counting Kit-8; d, days; ICA, icariin; SEM, scanning electron microscopy.
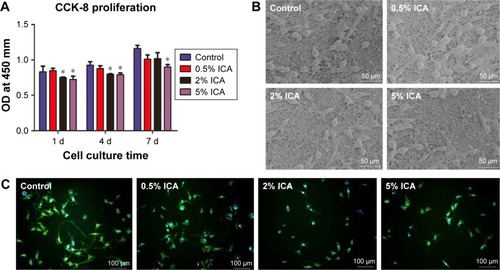
Figure 8 The morphology of the ICA-loaded PCL–gelatin membrane (A–C), and SEM micrographs of membrane surfaces (D–F) at different observation times after implantation.
Note: The black arrows indicate the absorbed margin, and the white arrows indicate the pores.
Abbreviations: ICA, icariin; PCL, polycaprolactone; SEM, scanning electron microscopy.
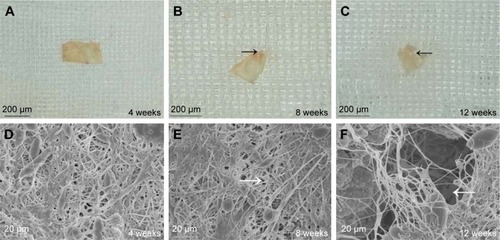
Figure 9 Gross evaluation of the adhesion formation (A) and hydroxyproline assessment (B) in untreated control, unloaded and ICA-loaded membrane groups.
Notes: &P<0.05 compared with the unloaded membrane group; *P<0.05 compared with the control group.
Abbreviation: ICA, icariin.
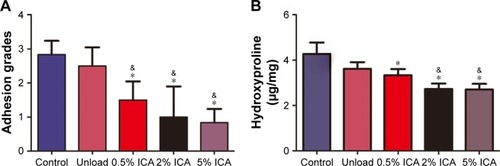
Figure 10 Histological micrographs of different PCL–gelatin membrane groups with H&E (A) and Masson (B) staining after laminectomy for 4 weeks.
Notes: Scale bar =200 μm. Arrows indicate the adhesion tissue.
Abbreviations: AT, adhesion tissue; ICA, icariin; PCL, polycaprolactone; SC, spinal cord.
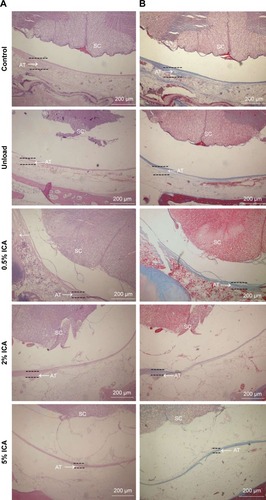
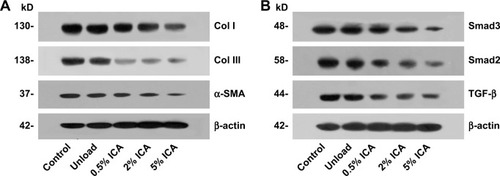
Figure 11 Western blot assay for col I/III, α-SMA (A) and TGF-β, Smad2/3 (B) expression in adhesion tissues with different membrane groups for 4 weeks.
Abbreviations: Col I, collagen I; Col III, collagen III; ICA, icariin; kD, k Daleon.
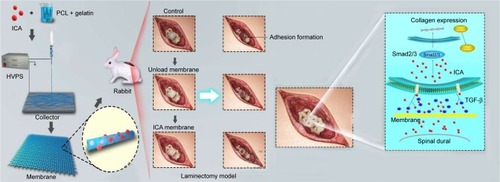
Scheme 1 Schematic illustration of preparing PCL–gelatin membrane and the use of PCL–gelatin membrane in the laminectomy model to prevent adhesion formation, and the diagram showing the possible ways of inhibition of the TGF-β and Smad pathways by ICA.
Abbreviations: HVPS, high-voltage power supply; ICA, icariin; PCL, polycaprolactone.