Figures & data
Figure 1 Characterization of the synthesized Ag/AuNRs. (A) and (B) transmission electron microscope images of Ag/AuNRs. (C) and (D) statistical analysis of the length, width and aspect ratio of the synthesized Ag/AuNRs in (A) and (B), respectively. A Gaussian distribution was fitted for each plot. (E) EDX analysis of Ag/AuNRs. (F) UV-Vis spectra of Ag/AuNRs on days 1 and 30, stored at room temperature.
Abbreviation: EDX, energy dispersive X-ray; UV-Vis, ultraviolet-visible.
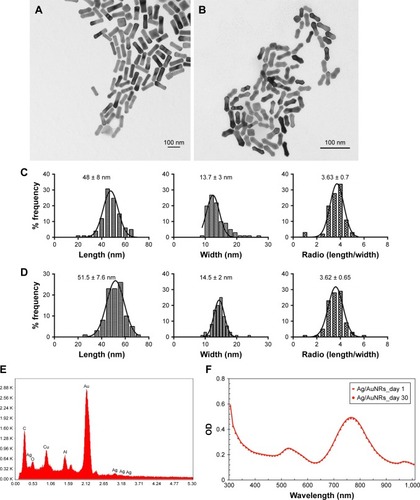
Figure 2 Bacteria growth curves for Gram-negative bacteria strains: (A) Pseudomonas aeruginosa and (B) Escherichia coli and Gram-positive bacteria strains, (C) Staphylococcus aureus, and (D) Staphylococcus epidermidis under different concentrations of Ag/AuNRs.
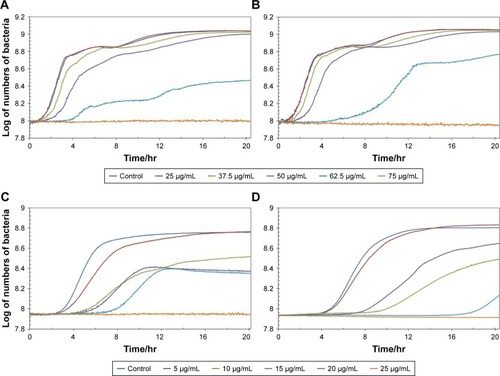
Figure 3 TEM images of Staphylococcus aureus after treated with 15 µg/mL of Ag/AuNRs for 24 hours. Arrows indicate where “Pits” were formed on the cell membrane.
Note: (A) Low magnification, (B) high magnification.
Abbreviation: TEM, transmission electron microscope.
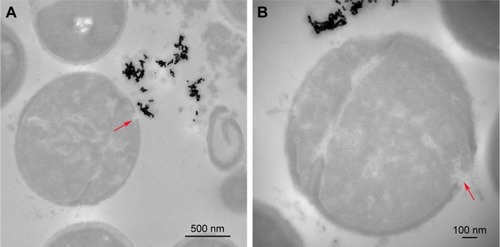
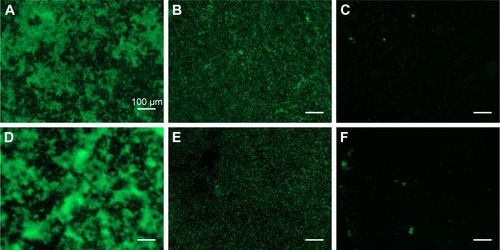
Figure 4 Fluorescence imaging of Staphylococcus aureus (A–C) and Staphylococcus epidermidis (D–F) after treating with Ag/AuNRs for 24 hours at a concentration of 0 (A, D), 15 (B, E) and 25 (C, F) µg/mL, respectively.