Figures & data
Figure 1 Schematics depicting fusion and exocytosis process of insulin granules.
Notes: Channels: yellow: K, light purple: glucose, blue: Ca; organelles: light purple: endoplasmic reticulum, dark purple: nucleus, green: Golgi apparatus, pink: mitochondria, particles: red: insulin granules and yellow: secreted insulin. (A) Glucose and K channels are opened and Ca channel is closed. (B) Glucose enters the cell and ADP is converted to ATP, K channel is closed and Ca channel is opened. Insulin granules move toward the plasma membrane. (C) Insulin granules dock to plasma membrane and release insulin. (D) Inset of the black rectangle shown in (C).
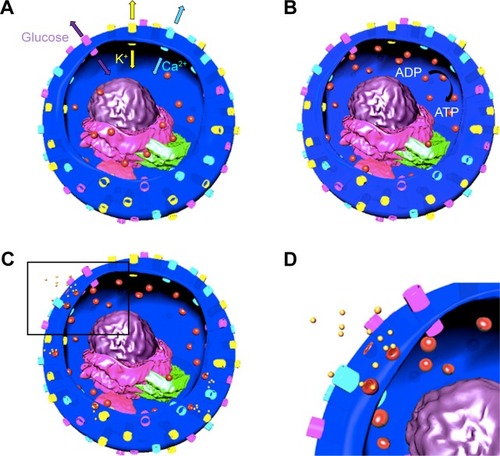
Figure 2 (A) β-cells are in KR2 low glucose medium encapsulated in graphene liquid cells. Cells are hermetically sealed between two biocompatible monolayers of graphene by the van der Waals forces. (B) False colored HAADF-STEM image of β-cells located in GLC sample. Red, β-cell; yellow, cell medium; green, copper mesh on TEM grid. Excessive thickness of the cells makes the intracellular structural details less visible. Scale bar: 10 µm. (C) Cell viability was tested via cell counter and reported as 1) no added fluorescence stain at t=0; 2) after keeping the cells as unstained (t: 6 hours); 3) as stained (t: 6 hours); and 4) after being imaged for 2 hours via GLC-TEM and was reported as 97, 91, 88% and 73% viable, respectively. (D) Cells were stained and imaged via GLC-TEM and the effect of GLC-TEM imaging was tested. Fluorescence microscopy image showed 73 green and 27 red cells, exhibiting 73% cell viability at t: 6 hours. Orange, white, green and red arrows show TEM grid, tweezer, live and dead cells, respectively. (E) Low loss EELS data show the presence of water optical gap at 6.9 eV, water exciton peak at 8.5 eV and graphene σ+π bond at 14 eV shown with blue, red and green arrows, respectively. These show encapsulations in between graphene and the presence of water. (F) The EDS data on secreted insulin granules indicated the presence of calcium and very low amounts of zinc, which are fingerprints for secreted insulin granules.
Abbreviations: arb, arbitrary; HAADF-STEM, high-angle annular dark field-scanning transmission electron microscopy; GLC, graphene liquid cell; TEM, transmission electron microscopy; EELS, electron energy loss spectroscopy; EDS, energy dispersive X-ray spectroscopy.
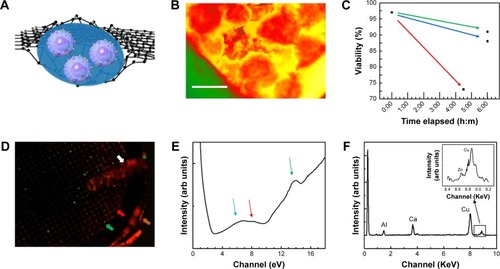
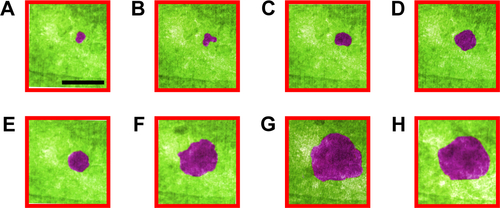
Figure 3 (A–H) False colored TEM images from Supplementary video S1 recorded for full fusion.
Notes: Blue, cell medium; purple, insulin; green, cell. (A) Cell, cell medium and a small insulin particle are shown at t: 0 seconds. (B–F) show the time sequences of t: 2, 4, 6, 8, 16, and 32 seconds. Insulin granule grows to its full size. Aspect ratio increases until t: 16 seconds and stays the same until t: 64 seconds. (F) (t: 32 seconds). Fully grown particle is visible. Particle formation and following docking on the membrane in an omega shape (Ω) were known to be typical for these particles. (G) Retrieval of the granule (t: 60 seconds) and (H) (t: 120 seconds). Release of insulin was observed with aspect ratio further increasing. (I) Insulin granule morphology, size and aspect ratio change during full fusion. Scale bar: 200 nm; magnification 300,000×.
Abbreviation: TEM, transmission electron microscopy.
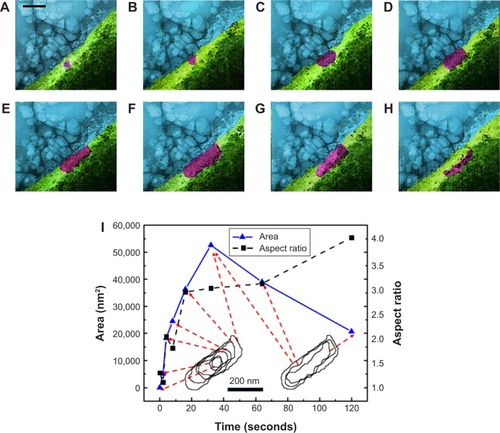
Figure 4 (A–L) TEM images from Supplementary video S2 recorded for sequential exocytosis with 0.5-second intervals. Region 1: cell, region 2: plasma membrane, region 3: cell medium. At t: 0 seconds, insulin particle with cyan arrow is shown (A). Formation and attachment of one new granule to the already anchored insulin is shown with purple arrow at t: 0.5 seconds (B), with dark blue arrow at t: 1 seconds (C), with light blue and dark green arrows at t: 1.5 seconds (D), with light green arrow at t: 2 seconds (E), with orange arrow grows at t: 2.5 seconds (F), red arrow at t: 3 seconds (G), yellow arrows at t: 3.5 seconds (H), at t: 4 seconds (I), at t: 4.5 seconds (J), with black, purple and brown arrows at t: 5 seconds (K), white, gray and pink arrows at t: 5.5 seconds (L). Attraction of these particles toward themselves (E) and retrieval of these granules by time toward PM is monitored as well. Scale bar: 200 nm.
Abbreviations: TEM, transmission electron microscopy; PM, plasma membrane.
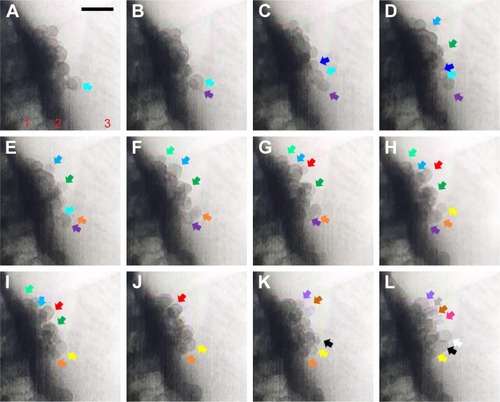
Figure S1 (A–H) False colored TEM images from Supplementary video 3 recorded for full fusion. Growth of insulin was reported at t: 0, 2, 4, 8, 16, 32, 64 and 120 seconds. Scale bar: 200 nm.
Abbreviation: TEM, transmission electron microscopy.