Figures & data
Table 1 Physical properties of silver nanoparticles (Ag NPs) in Ag/zeolite synthesized at different AgNO3 concentrations: A1 0.5%, A2 1.0%, A3 1.5%, A4 2.0%, and A5 5.0%
Table 2 Average inhibition zone and standard deviation for zeolite, AgNO3/zeolite (A0,) and Ag/zeolite at different AgNO3 concentrations: A2 1.0%, A4 2.0%, and A5 5.0%
Figure 1 Schematic illustration of the synthesis of the silver nanoparticles into the zeolite framework by strong chemical reduction.
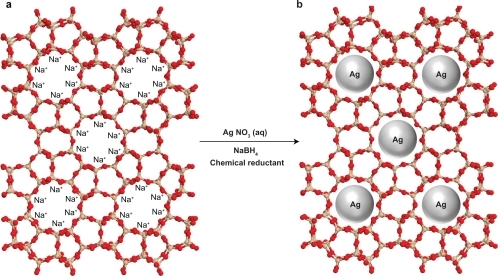
Figure 2 Photograph of AgNO3/zeolite (A0) and Ag/zeolite nanocomposites at different AgNO3 concentrations: A1 0.5%, A2 1.0%, A3 1.5%, A4 2.0%, and A5 5.0%.
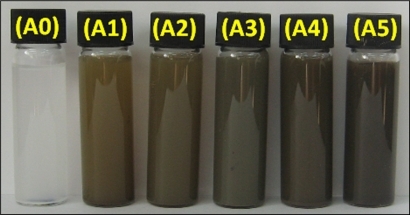
Figure 3 Ulraviolet-visible absorption spectra of silver/zeolite nanocomposites for different AgNO3 concentrations: A1 0.5%, A2 1.0%, A3 1.5%, A4 2.0%, A5 5%, and A0 AgNO3/zeolite in the absence of NaBH4.
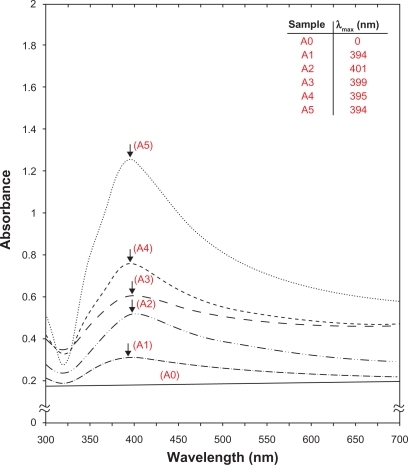
Figure 4 Powder X-ray diffraction patterns of zeolite and silver/zeolite nanocomposites for determination of nanosilver crystals at different AgNO3 concentrations (0.5, 1.0, 1.5, 2.0, and 5.0% [A1–A5]).
![Figure 4 Powder X-ray diffraction patterns of zeolite and silver/zeolite nanocomposites for determination of nanosilver crystals at different AgNO3 concentrations (0.5, 1.0, 1.5, 2.0, and 5.0% [A1–A5]).](/cms/asset/31cbaf4a-fc18-4e78-b3cd-cf465f440614/dijn_a_16964_f0004_c.jpg)
Figure 5 Transmission electron microscopy images of A) zeolite and B) zeolite after impregnation with aqueous AgNO3 (AgNO3/zeolite [A0]).
![Figure 5 Transmission electron microscopy images of A) zeolite and B) zeolite after impregnation with aqueous AgNO3 (AgNO3/zeolite [A0]).](/cms/asset/b8242897-d6c1-48cb-bb33-0a420a49d596/dijn_a_16964_f0005_b.jpg)
Figure 6 Transmission electron microscopy images and corresponding particle size distribution of silver/zeolite nanocomposites at different AgNO3 concentrations (A2 1.0% [A, B], A4 2.0% [C, D], and A5 5.0% [E, F]).
![Figure 6 Transmission electron microscopy images and corresponding particle size distribution of silver/zeolite nanocomposites at different AgNO3 concentrations (A2 1.0% [A, B], A4 2.0% [C, D], and A5 5.0% [E, F]).](/cms/asset/bfd6c6be-e20a-47ec-bdae-33f1b626ac4d/dijn_a_16964_f0006_c.jpg)
Figure 7 Scanning electron microscopy micrographs and energy dispersive X-ray fluorescence spectrometer spectra, respectively, for the zeolite (A, B) and silver/zeolite nanocomposites (A2 1.0% [C, D], A4 2.0% [E, F], and A5 5.0% [G, H]).
![Figure 7 Scanning electron microscopy micrographs and energy dispersive X-ray fluorescence spectrometer spectra, respectively, for the zeolite (A, B) and silver/zeolite nanocomposites (A2 1.0% [C, D], A4 2.0% [E, F], and A5 5.0% [G, H]).](/cms/asset/b1be4590-9535-419d-8db8-f0c89fbc66c9/dijn_a_16964_f0007_c.jpg)
Figure 8 Fourier transform infrared spectra of zeolite and silver/zeolite nanocomposites (A2 1.0%, A4 2.0%, and A5 5.0%).
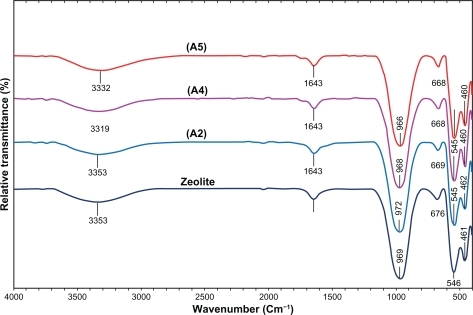
Figure 9 Comparison of the inhibition zone test between Gram-negative and Gram-positive bacteria (ie, E. coli [A], S. dysentriae [B], S. aureus [C], and MRSA [D]) form zeolite, A0, A1, A2, and A5 (1–5), respectively.
Abbreviations: E. coli, Escherichia coli; MRSA, methicillin-resistant Staphylococcus aureus; S. dysentriae, Shigella dysentriae.
![Figure 9 Comparison of the inhibition zone test between Gram-negative and Gram-positive bacteria (ie, E. coli [A], S. dysentriae [B], S. aureus [C], and MRSA [D]) form zeolite, A0, A1, A2, and A5 (1–5), respectively.Abbreviations: E. coli, Escherichia coli; MRSA, methicillin-resistant Staphylococcus aureus; S. dysentriae, Shigella dysentriae.](/cms/asset/d4895b19-599e-4f6b-864a-e3e7f31d81e8/dijn_a_16964_f0009_c.jpg)