Figures & data
Table 1 Physicochemical characteristics of hyperbranched polylysine nanoparticles loaded with pDNA (ie, pGeneClip™ hMGFP)
Figure 1 Scanning electron micrograph of hyperbranched polylysine nanoparticles. Scale bar = 200 nm.
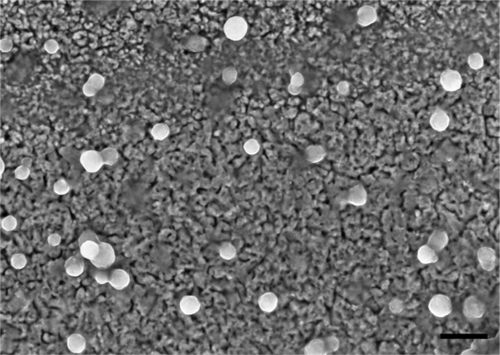
Figure 2 Concentration-dependent internalization of hyperbranched polylysine nanoparticles in primary cochlear cell culture.
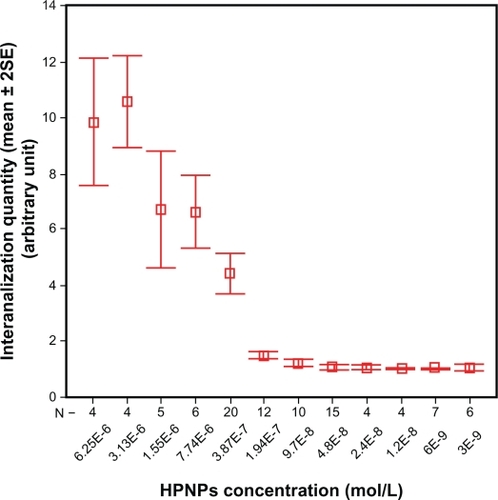
Figure 3 HPNP vesicle formation in both the cytoplasm and nuclei was observed at concentrations below 3.87 × 10⁻⁷ mol/L [A) 3.87 × 10⁻⁷ mol/L, B) 1.94 × 10⁻⁷ mol/L, C) 9.7 × 10⁻⁸ mol/L, D) 4.8 × 10⁻⁸ mol/L, E) 2.4 × 10⁻⁸ mol/L, F) 1.2 × 10⁻⁸ mol/L, G) 6 × 10⁻⁹ mol/L, and H) 3 × 10⁻⁹ mol/L]. Nuclear permeation of propidium iodide was not detected in these cells. Perinuclear distribution of dot-like propidium iodide vesicle was observed in B (arrow).
Notes: Green: FITC-conjugated HPNPs. Red: propidium iodide permeation. Blue: nuclear staining by DAPI. Scale bar = 5 μm.
Abbreviation: HPNPs, hyperbranched polylysine nanoparticles.
![Figure 3 HPNP vesicle formation in both the cytoplasm and nuclei was observed at concentrations below 3.87 × 10⁻⁷ mol/L [A) 3.87 × 10⁻⁷ mol/L, B) 1.94 × 10⁻⁷ mol/L, C) 9.7 × 10⁻⁸ mol/L, D) 4.8 × 10⁻⁸ mol/L, E) 2.4 × 10⁻⁸ mol/L, F) 1.2 × 10⁻⁸ mol/L, G) 6 × 10⁻⁹ mol/L, and H) 3 × 10⁻⁹ mol/L]. Nuclear permeation of propidium iodide was not detected in these cells. Perinuclear distribution of dot-like propidium iodide vesicle was observed in B (arrow).Notes: Green: FITC-conjugated HPNPs. Red: propidium iodide permeation. Blue: nuclear staining by DAPI. Scale bar = 5 μm.Abbreviation: HPNPs, hyperbranched polylysine nanoparticles.](/cms/asset/33d81e5e-a556-41dd-a6e5-89f5dd5b91d1/dijn_a_16973_f0003_c.jpg)
Figure 4 Internalization of HPNP-induced permeation of propidium iodide in primary cochlear cell culture. A–C) The cochlear cells were incubated with HPNPs at a concentration of 6.25 × 10⁻⁶ mol/L. B) Nuclear permeation of propidium iodide was observed in all the tested cells. C) Shows the merged images of A and B. D–F) The cochlear cells were incubated with HPNPs at a concentration of 3.87 × 10⁻⁷ mol/L. E) Nuclear permeation of propidium iodide was observed in most of the cells. F) Shows the merged images of D and E. G–I) Internalization of HPNP-induced permeation of propidium iodide in a single cell (higher magnification) at a concentration of 6.25 × 10⁻⁶ mol/L. G) Homogenous and condensed distribution of HPNPs was detected in the cytoplasm and entire nucleus. I) Shows the merged images of G and H.
Notes: Green: FITC-conjugated HPNPs. Red: propidium iodide permeation. Blue: nuclear staining by DAPI. Scale bars: A–F = 100 μm, G–I = 10 μm.
Abbreviation: HPNPs, hyperbranched polylysine nanoparticles.

Figure 5 Death of different cochlear cell populations was induced by HPNP internalization. A–F) Internalization of HPNPs by the cochlear hair cell. Cytoplasmic vesicles and condensed homogenous nuclear distribution of HPNPs appeared in the outer hair cell incubated with 3.87 × 10⁻⁷ mol/L HPNPs (A–C) and inner hair cell incubated with 5 × 10⁻⁶ mol/L HPNPs (D–F). Vesicles were observed in the hair bundles (arrows in A and C). Figures B and E showed the permeation of propidium iodide. G–I) Spiral ganglion cell death was induced by HPNP internalization at a concentration of 9.7 × 10⁻⁸ mol/L (Arrow in G shows HPNPs in the neural soma of spiral ganglion cell). H) Shows the permeation of propidium iodide. I) shows the merged images of G and H (Arrow: nerve fiber. Arrow head: nuclei of Schwann cell). J–M) The nucleus was compressed by HPNP vesicles, and propidium iodide permeated the nucleus when the cells were exposed to 3.87 × 10⁻⁷ mol/L HPNPs (arrows). M is the merged image.
Notes: Green: FITC-conjugated HPNPs. Red: propidium iodide permeation. Blue: nuclear staining by DAPI. Scale bars: A–C = 5 μm, D–F = 7.1 μm, G–M = 5 μm.
Abbreviation: HPNPs, hyperbranched polylysine nanoparticles.
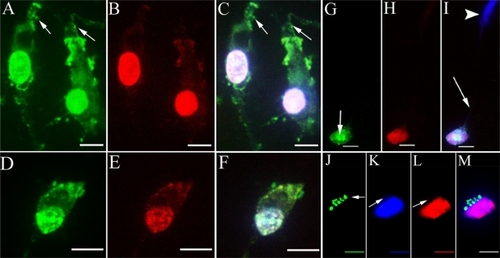
Figure 6 A HPNP vesicle pathway from the cytoplasm towards the nucleolin-positive nucleolus was observed in the primary cochlear cell culture exposed to HPNPs (arrows in A and C).
Notes: Green: FITC-conjugated HPNPs. Red: nucleolin. Blue: nuclear staining by DAPI. Scale bar = 10 μm.
Abbreviation: HPNPs, hyperbranched polylysine nanoparticles.
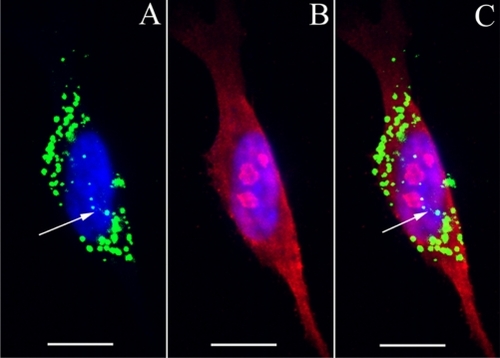
Figure 7 Uptake of HPNPs in the cochlear organotypic culture. The tissues were incubated with 2.5 × 10⁻⁶ mol/L (A, B) and 1 × 10⁻⁵ mol/L (C, D) HPNPs for 24 hours. A and B are merged images of HPNPs, Myosin VIIA, and DAPI in the modiolus (A) and organ of Corti (B). C) low magnification and D) higher magnification are merged images of HPNPs, F-actin, and DAPI in the lateral wall.
Notes: Green: FITC-conjugated HPNPs. Red: Myosin VIIA (A, B), F-actin stained by TRITC-conjugated phalloidin (C, D). Blue: nuclear staining by DAPI. Scale bars: A, C = 103.4 μm, B, D = 10 μm.
Abbreviation: HPNPs, hyperbranched polylysine nanoparticles.
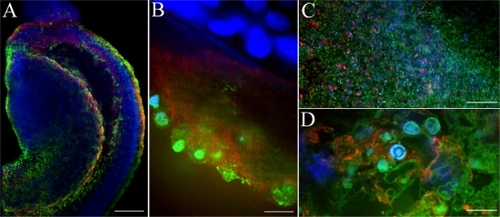
Figure 8 Uptake of HPNPs in the cochlea 24 hours after round window membrane administration in an adult rat. A gelatin sponge was immersed in 10−3 mol/L HPNPs and placed on the round window membrane. A) Lateral view of reconstructed three-dimensional image of the round window membrane showing the gradient distribution of HPNPs; both condensed homogenous nuclear distribution of HPNPs (arrow head) and HPNP vesicles (arrow) were observed. B) Middle ear mucosal uptake of HPNPs. Condensed homogenous nuclear distribution of HPNPs (arrow head) and HPNP vesicles (arrow) were detected. C) Perinuclear distribution of HPNPs was observed in the spiral ganglion cell (arrow). D) HPNPs were found in the organ of Corti. Cytoplasmic distribution of HPNPs was observed in the hair cells, and both cytoplasmic and perinuclear distribution of HPNPs was detected in the supporting (border) cells. E) Both cytoplasmic and nuclear distribution of HPNPs was detected in the stria marginal cells, the typical tight junctions of the stria marginal cells are shown using F-actin staining (arrow). F) Abundant HPNPs were observed in the spiral ligament fibrocytes. G) Abundant HPNPs were detected in the endothelium of the stapedial artery including the nuclear HPNP vesicles (arrow).
Notes: Green: FITC-conjugated HPNPs. Red: F-actin stained by TRITC-conjugated phalloidin. Blue: nuclear staining by DAPI. Scale bar = 10 μm.
Abbreviations: BC, border cells; HPNPs, hyperbranched polylysine nanoparticles; IHC, inner hair cell; IS, inner side of the round window membrane; OHC, outer hair cell; OS, outer side of the round window membrane; 1, 2, 3: row 1, row 2, and row 3 of OHC.
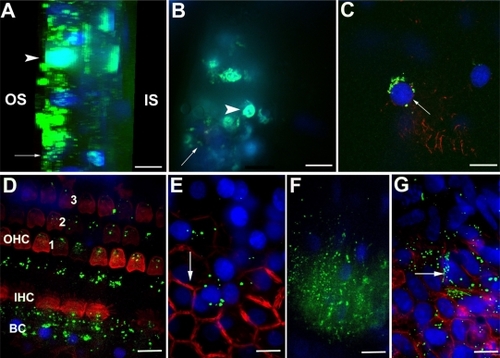
Figure 9 The cell viability of L929 mouse fibroblasts is dependent on the concentration of HPNPs applied. The ED50 was calculated as 10−6.2 mol/L (dashed line). The internalization of the HPNPs is also concentration-dependent.
Abbreviations: NC, untreated control; HPNPs, hyperbranched polylysine nanoparticles.
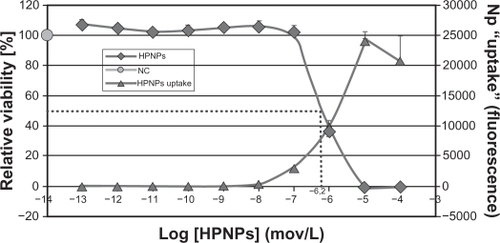
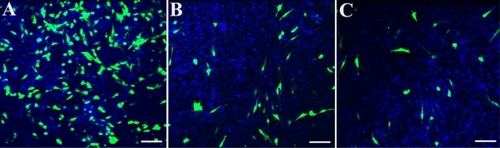
Figure 10 HPNP-mediated transfection in NIH 3T3 cells and primary cochlear cells with the pGeneClip™ hMGFP plasmid observed by fluorescent microscopy. A) The transfection efficiency mediated by HPNPs at an N/P (w/w) ratio of 5:1 in NIH 3T3 cells was 29.8%. B) The transfection efficiency mediated by HPNPs at an N/P (w/w) ratio of 5:1 in cochlear cells was 8.7%. C) Positive control, the transfection efficiency mediated by Lipofectamine™ in cochlear cells was 6.0%, which is lower than the transfection efficiency mediated by HPNPs.
Notes: Green: Green fluorescent protein expression. Blue: nuclear staining by DAPI. Scale bar = 100 μm.
Abbreviation: HPNPs, hyperbranched polylysine nanoparticles.