Figures & data
Table 1 Characterization of CS-PCL
Table 2 Primers used for quantitative qPCR
Figure 1 Proton nuclear magnetic resonance spectra of CS-PCL (A), PCL (B), and CS (C).
Abbreviations: CS, chitosan; CS-PCL, cationic chitosan-graft-poly (ɛ-caprolactone); DMSO, dimethyl sulfoxide; PCL, polycaprolactone.
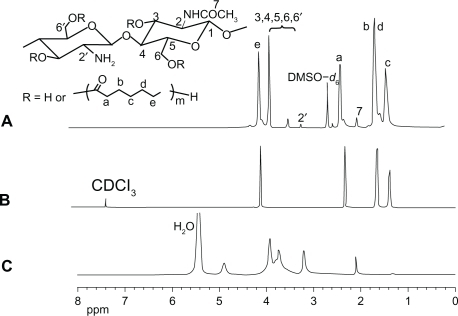
Figure 2 Fourier-transform infrared spectra of CS-PCL (A), PCL (B), and CS (C).
Abbreviations: CS, chitosan; CS-PCL, cationic chitosan-graft-poly (ɛ-caprolactone); PCL, polycaprolactone.
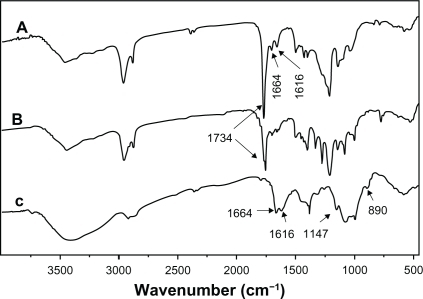
Figure 3 Scanning electron microscopy images of electrospun nanofibous scaffolds prepared from different CS-PCL/PCL weight ratios: CS-PCL (A), CS-PCL/PCL (80/20) (B), CS-PCL/PCL (60/40) (C), CS-PCL/PCL (40/60) (D), CS-PCL/PCL (20/80) (E), and PCL (F).
Abbreviations: CS-PCL, cationic chitosan-graft-poly (ɛ-caprolactone); PCL, polycaprolactone.
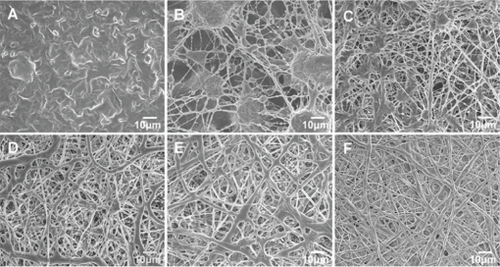
Table 3 Fiber diameter, porosity, and water contact angle properties of different electrospun nanofibrous scaffolds
Table 4 Atomic ratios of carbon, nitrogen, and oxygen on the surface of CS-PCL/PCL (40/60), CS-PCL/PCL (20/80), and PCL nanofibrous scaffolds determined by x-ray photoelectron spectroscopy
Figure 4 Zeta-potential curve for electrospun nanofibrous scaffolds (n = 5).
Abbreviation: CS-PCL, cationic chitosan-graft-poly (ɛ-caprolactone).
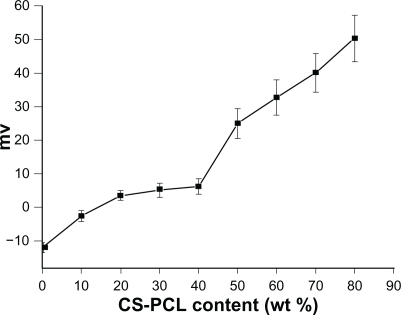
Figure 5 Fluorescent micrograph of mRPC density on CS-PCL/PCL (40/60) (A–C), CS-PCL/PCL (20/80) (D–F), PCL (G–I) nanofibrous scaffolds, and the cell culture plates (TCPS) (J–L) on day 1, 4, and 7 after incubation (green = endogenous GFP expression). Scale bar: 100 μm.
Abbreviations: CS-PCL, cationic chitosan-graft-poly (ɛ-caprolactone); GFP, green fluorescent protein; PCL, polycaprolactone; mRPC, mouse retinal progenitor cell; TCPS, tissue culture polystyrene.
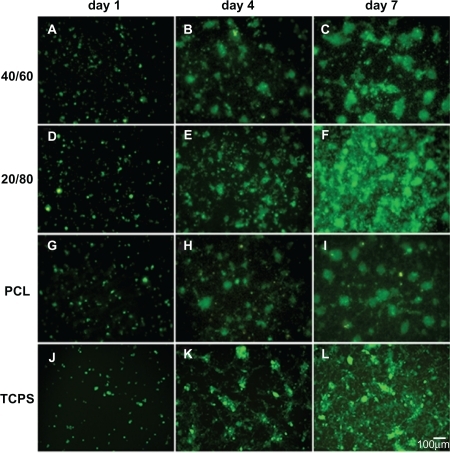
Figure 6 Analysis of mRPC proliferation on PCL and CS-PCL/PCL nanofibrous scaffolds and the cell culture plates (TCPS), measured by MTS assay.
Notes: Bar represents mean ± standard deviation (n = 4). *P < 0.05.
Abbreviations: CS-PCL, cationic chitosan-graft-poly (ɛ-caprolactone); mRPC, mouse retinal progenitor cell; MTS, 3-(4,5-dimethylthiazol-2-yl)-5-(3-carboxymethoxyphenyl)-2-(4-sulfophenyl)-2H-tetrazolium; OD, optical density; PCL, polycaprolactone; TCPS, tissue culture polystyrene.
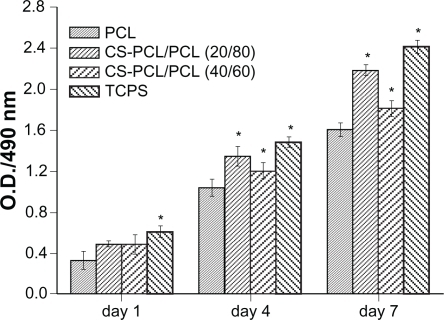
Figure 7 Scanning electron microscopy images of mRPCs grown on CS-PCL/PCL (20/80) (A–C) and PCL (D–F) nanofibrous scaffolds on day 1 (A, D), 4 (B, E), and 7 (C, F) after incubation.
Abbreviations: CS-PCL, cationic chitosan-graft-poly (ɛ-caprolactone); mRPC, mouse retinal progenitor cell; PCL, polycaprolactone.
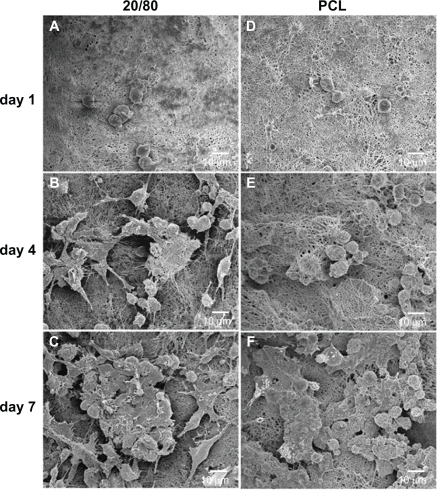
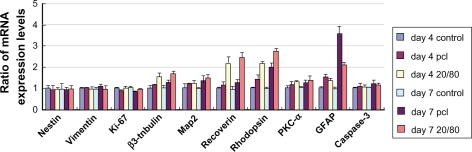
Figure 8 Gene expression profile of mRPCs grown on CS-PCL/PCL (20/80) and PCL scaffolds on day 4 and 7.
Note: The error bars show standard deviation (n = 3).
Abbreviations: CS-PCL, cationic chitosan-graft-poly (ɛ-caprolactone); GFAP, glial fibrillary acidic protein; mRPC, mouse retinal progenitor cell; PCL, polycaprolactone; PKC-α, protein kinase C alpha.