Figures & data
Figure 1 TEM image showing nanosilver particles of sizes <100 nm.
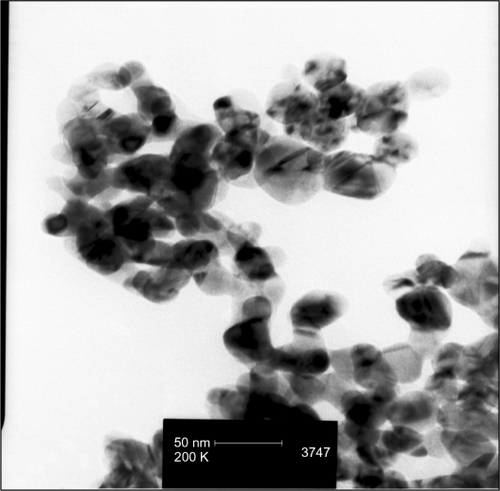
Figure 2 Nanosilver particles by XRD were observed in the ranges of 38, 44, 64/5 degrees (2θ).
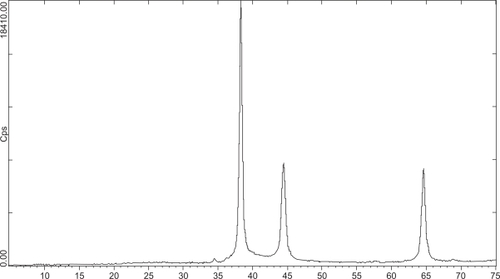
Figure 3 H&E stained skin sections in an acute toxicity study (× 40). A) Negative control; B) AgNO3 group: reduced thickness of epidermis and increased regular collagen fiber in papillary layer and mononuclear inflammation; C) Low-dose nanosilver group with reduced thickness of epidermis, reduced thickness of papillary layer, and regular collagen fibers; D) High-dose nanosilver group with reduced thickness of epidermis, reduced thickness of papillary layer, and irregular collagen fibers.
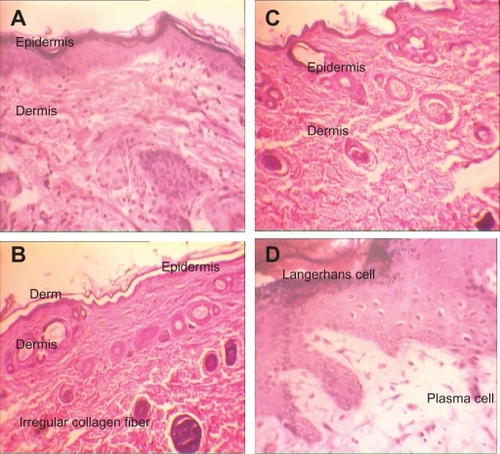
Table 1 Dermal histopathologic changes in acute study
Figure 4 H&E stained skin sections in subchronic toxicity (× 40). A) Normal skin in control group; B) AgNO3 group with reduced thickness of dermis and epidermis, increased Langerhans cells, inflammation, decreased thickness of papillary zone layer, and increased collagen levels of dermis layer; C) Skin abnormalities in low-dose nanosilver group; D) Skin abnormalities in high-dose nanosilver group; E) Highest level of dermal toxicity (see text for further details).
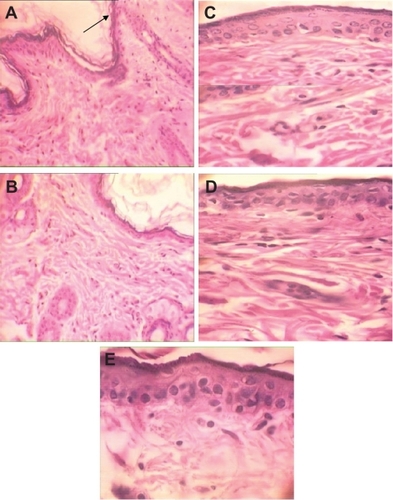
Table 2A Dermal histopathologic changes in subchronic test
Table 2B Liver histopathologic changes in subchronic test
Table 2C Histopathologic changes of the spleen in subchronic test
Figure 5 H&E stained liver sections in subchronic toxicity (× 40). A) Normal liver in control group; B) AgNO3 group with hepatic cord deformation; C) Overproduction of Kupffer cells and degeneration of hepatocytes in low-dose nanosilver group; D) Overproduction of Kupffer cells and degeneration of hepatocyte in medium-dose nanosilver group; E) Liver necrosis in nanosilver high-dose group.
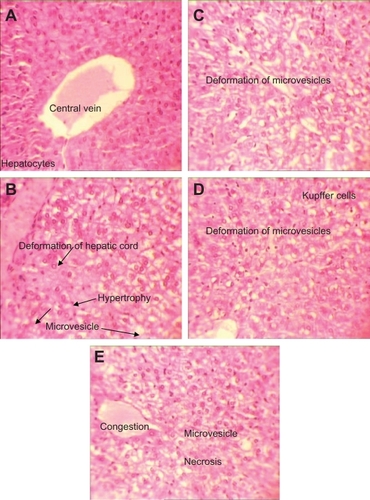
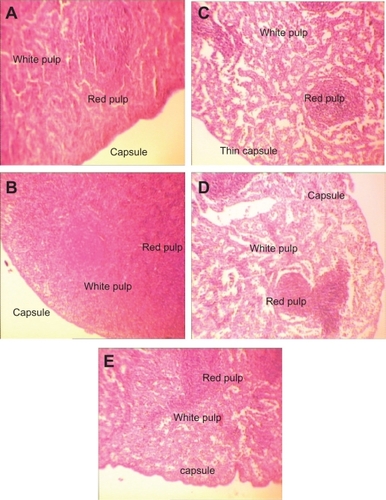
Figure 6 H&E stained spleen sections in subchronic toxicity study (× 40). A) Normal spleen in control group. B) Thin red capsule with inflammation and white pulp hypertrophy in AgNO3 group; C) Thin capsules with inflammation, accumulation of red blood cells (RBC), and white pulp atrophy in low-dose nanosilver group; D) Thin capsules with inflammation, accumulation of RBC, and white pulp atrophy in medium-dose nanosilver group; E) The highest levels of red pulp inflammation, white pulp atrophy, and thinnest capsule in high-dose nanosilver group.