Figures & data
Table 1 Physical properties of Ag NPs in Ag/MMT NCs synthesized at different AgNO3 concentrations: (S1) 0.5%, (S2) 1.0%, (S3) 1.5%, (S4) 2.0%, and (S5) 5.0%
Table 2 Average inhibition zone and standard deviation for MMT, AgNO3/MMT (S0), and Ag/MMT NCs at different AgNO3 concentrations: (S2) 1.0%, (S4) 2.0%, and (S5) 5.0%
Figure 1 Schematic illustration of the synthesized Ag NPs in the interlayer space of MMT suspension by chemical reduction method.
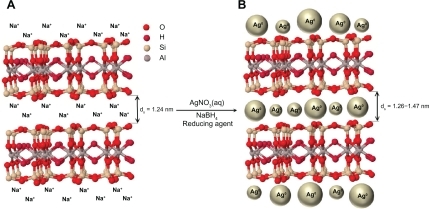
Figure 2 Photograph and UV-visible absorption spectra of Ag/MMT suspension for different AgNO3 concentrations; 0.5%, 1.0%, 1.5%, 2.0%, 5.0% (S1–S5), and (S0) AgNO3/MMT suspension.
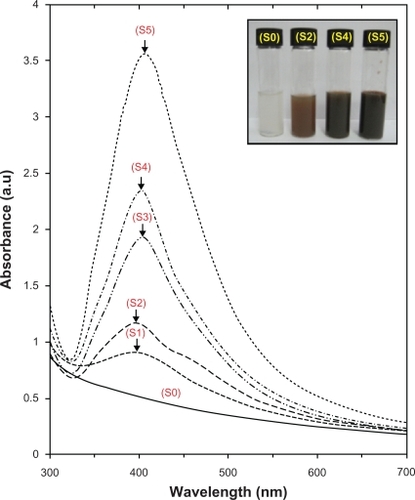
Figure 3 PXRD patterns of MMT and Ag/MMT NCs for determination of d-spacing at different AgNO3 concentrations: (S2) 1.0%, (S4) 2.0%, and (S5) 5.0%.
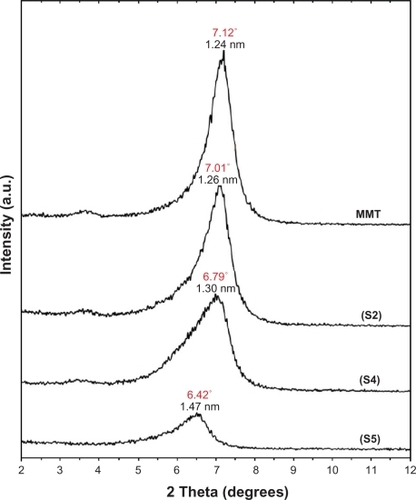
Figure 4 PXRD patterns of MMT and Ag/MMT NCs for determination of silver crystals at different AgNO3 concentrations: 0.5%, 1.0%, 1.5%, 2.0% and 5.0% (S1–S5).
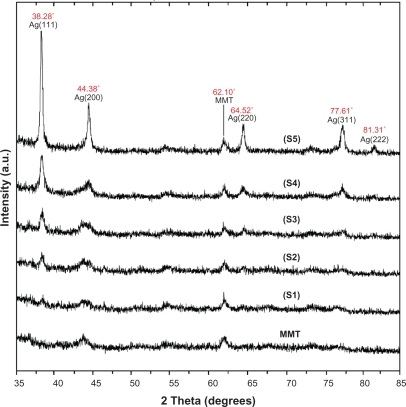
Figure 5 TEM images and corresponding particle size distribution of Ag/MMT NCs at different AgNO3 concentrations: 1.0% (A, B), 2.0% (C, D), and 5.0% (E, F).
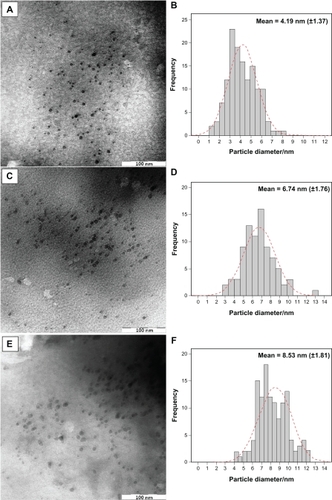
Figure 6 SEM micrographs and EDXRF spectra respectively for the MMT (A, B), Ag/MMT NCs at different AgNO3 concentrations: 1.0% (C), 2.0% (D), 5.0% (E), and (F).
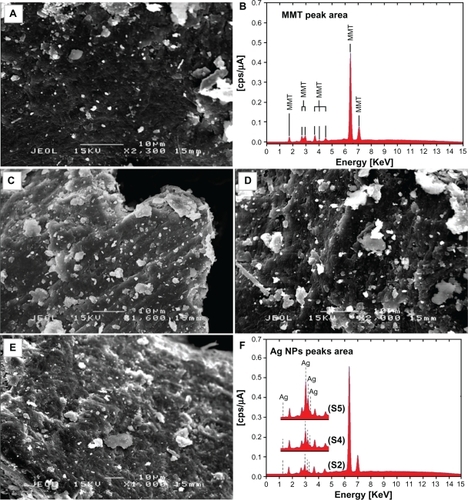
Figure 7 FT-IR spectra for the MMT and Ag/MMT NCs at different AgNO3 concentrations: (S2) 1.0%, (S4) 2.0%, (S5) 5.0%.
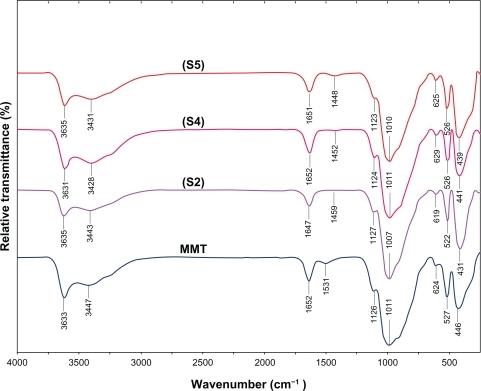
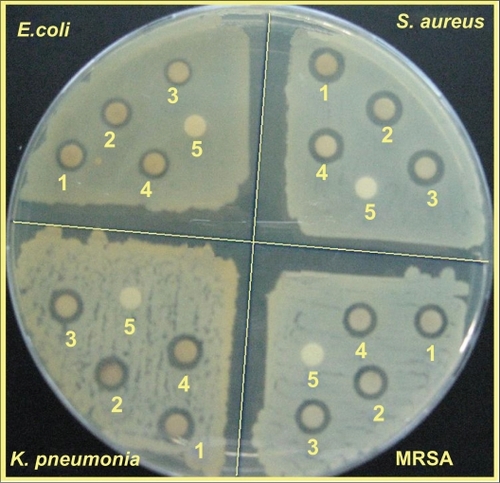
Figure 8 Comparison of the inhibition zone test between Gram-negative and Gram-positive bacteria (Escherichia coli, Klebsiella pneumoniae, Staphylococcus aureus, and methicillin-resistant S. aureus) form S0 (1), S2 (2), S4 (3), S5 (4), and MMT (5) respectively.