Figures & data
Scheme 1 CXCR4 antagonistic activity of CTC liposome and the joint pharmacodynamic effects of PF and AMD (A) Mechanism of CXCR4 antagonism and the combined effects of PF and AMD (B) Chemical structure of AMD (C) Chemical structure of PF.
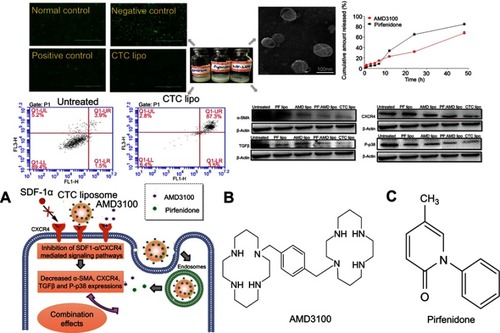
Table 1 Characteristics of different formulations
Figure 1 Physicochemical characterization of CTC liposomes (A) TEM image of CTC liposome (B) Size distribution histogram of CTC liposome (C) Zeta potential of blank liposomes and effect of different concentrations of AMD (D) Storage stability of CTC liposomes (E) PBS and FBS stability of CTC liposomes (F) Cumulative release of AMD and PF.
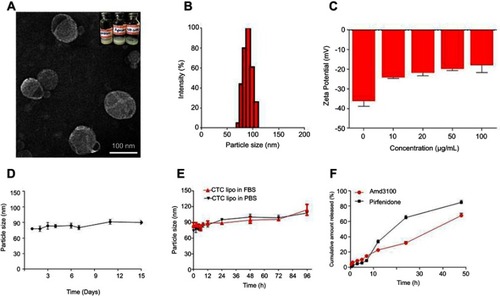
Figure 2 Cell viability of liposome encapsulated drugs and free drugs (A) PF free and PF liposome (B) AMD free and AMD liposome (C) Combination free drugs and combination liposome.
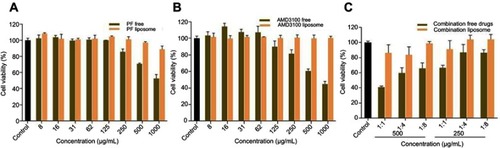
Figure 3 CXCR4 antagonism (A) Normal control; U2OS cells were treated with PBS (B) Negative control; U2OS cells treated with SDF-1α only. (C) Positive control; U2OS cells treated with SDF-1α and free AMD (D) Test sample; U2OS cells were treated with SDF-1α and CTC liposomes.
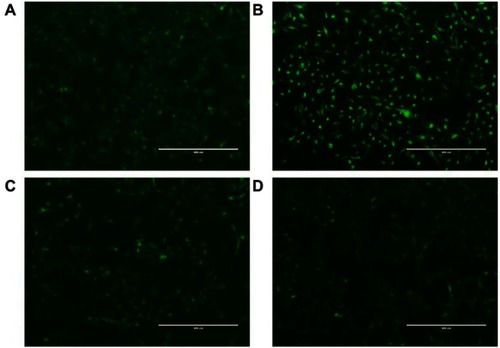
Figure 4 (A) Cellular uptake of C6-AMD-liposomes by HSC-T6 cells at a different time (0.5, 1, 2 h). The images were taken under 40x (magnification) using a confocal laser scanning microscope. Blue signal: DAPI; Green signal: C6 (B) The influence of AMD pre-treatment on cellular uptake of liposomes (C) Analysis of the endocytosis pathway of C6-AMD liposomes determined by flow cytometry and cells were treated with different endocytosis inhibitors. Student’s t-test was used to estimate the statistical significance of the differences in different groups. A two-sided “p” value less than 0.05 indicated statistical significance. *p<0.05, **p<0.01.
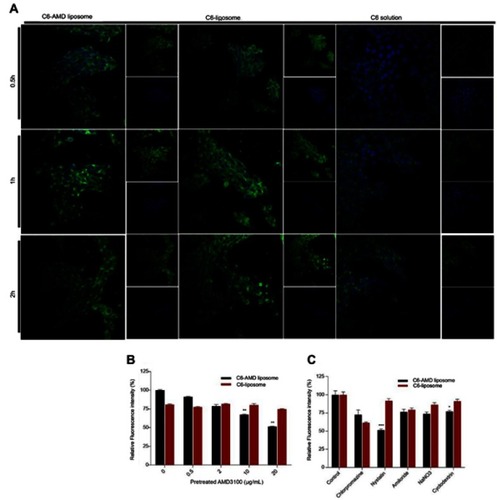
Figure 5 Effect of encapsulated and free drugs on apoptosis (A) Effect of liposomes on apoptosis in activated HSC-T6 cells (B) Effect of free drugs on apoptosis in activated HSC-T6 cells.
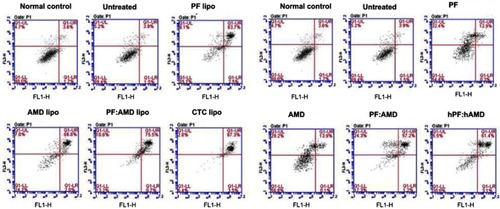
Figure 6 Effect of liposomes on α-SMA, CXCR4, TGFβ, and P-p38 expressions. Protein expression was determined by western blotting analyses (A) α-SMA expression (B) CXCR4 expression (C) TGFβ expression (D) P-p38 expression. The α-SMA, CXCR4, TGFβ expression and phosphorylation of p38 were determined as a ratio of the total α-SMA, CXCR4, TGFβ and P-p38 expressions to β-Actin, respectively (E) Relative α-SMA expression (F) Relative CXCR4 expression (G) Relative TGFβ expression (H) Relative P-p38 expression. One-Way ANOVA analysis was used to estimate the statistical significance in different groups in comparison with the untreated group. A two-sided “p” value of less than 0.05 indicated statistical significance. *p<0.05, **p<0.01, ***p<0.001, and ****p<0.0001.
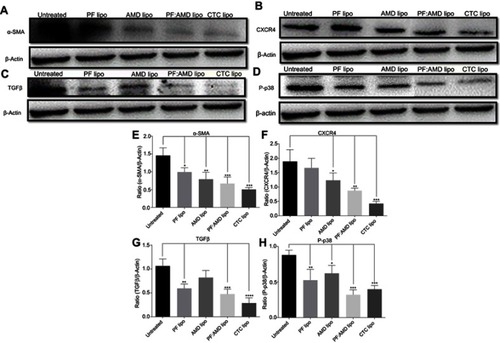
Figure 7 Effect of free drugs on α-SMA, CXCR4, TGFβ, and P-p38 expressions. Protein expressions were determined by western blotting analyses (A) α-SMA expression (B) CXCR4 expression (C) TGFβ expression (D) P-p38 expression. The α-SMA, CXCR4, TGFβ expression and phosphorylation of p38 were determined as a ratio of the total α-SMA, CXCR4, TGFβ and P-p38 expressions to β-Actin, respectively (E) Relative α-SMA expression (F) Relative CXCR4 expression (G) Relative TGFβ expression (H) Relative P-p38 expression. One-Way ANOVA analysis was used to estimate the statistical significance of the differences in different groups in comparison with the untreated group. A two-sided “p” value of less than 0.05 indicated statistical significance. *p<0.05, **p<0.01.
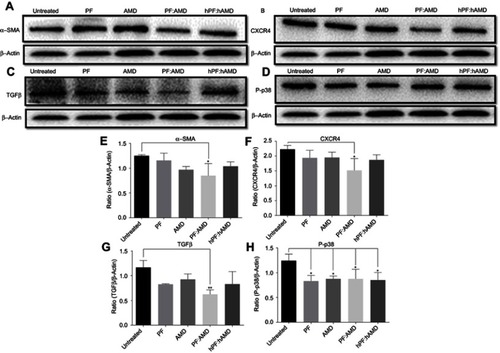
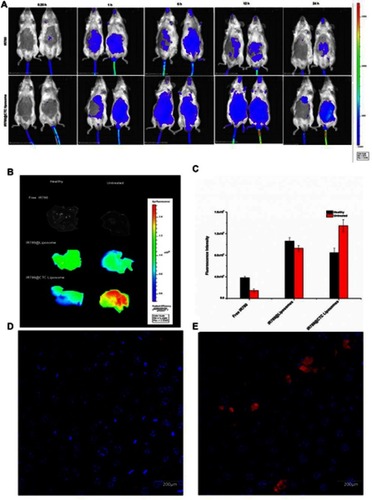
Figure 8 In-vivo biodistribution and drug accumulation (A) In-vivo biodistribution of IR780@CTC liposomes and free IR780 in healthy and fibrotic mice (B) Accumulation of IR780 in liver detected by ex-vivo imaging at 24 h post-injection in the livers of healthy and fibrotic mice (C) Fluorescence intensities of free IR780, IR780@liposomes, and IR780@CTC liposomes in the healthy and untreated groups (D-E) Detection of IR780 accumulation in healthy and untreated mice using Hoechst staining. Scale bar=200μm.