Figures & data
Figure 1 Release profile of PGZ from PGZ-NPs and Free-PGZ.
Abbreviations: PGZ, pioglitazone; NP, nanoparticles; AIC, Akaike’s information criterion.
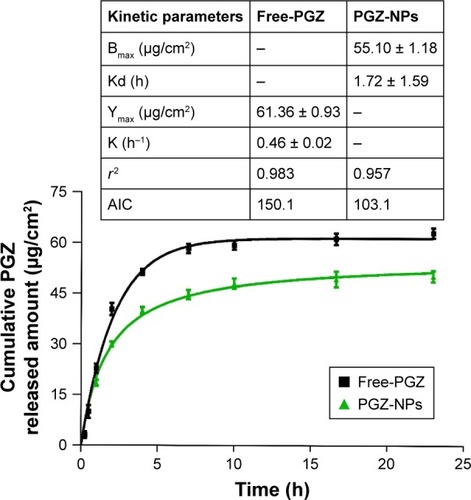
Figure 2 hCMEC/D3 cell viability measured by AB assay when exposed to 1.2–25 nM (0.5–10 µg/mL) PGZ-NPs and Rhod-NPs for 24 hours.
Notes: Data are shown as percentage of control (cell culture medium) which represents the maximum cell viability. Data are compared for each concentration of Rhod-NPs vs PGZ-NPs *P<0.05, **P<0.01, ****P<0.0001 by Student’s t-test (n=3).
Abbreviations: hCMEC/D3, human cerebral microvascular endothelial cell; AB, alamar blue; PGZ-NPs, PGZ-loaded nanoparticles; Rhod-NPs, Rhod-nanoparticles.
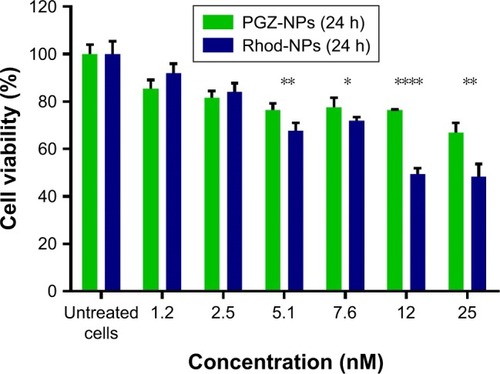
Figure 3 (A) FACS histograms of 10,000 hCMEC/D3 cells treated for 3 hours with Rhod-NPs or untreated cells. (B) Time-dependent interaction of Rhod-NPs with hCMEC/D3. Each value is the mean of the median fluorescence of 10,000 cells from three independent experiments. ***P<0.001, ****P<0.0001 by one way ANOVA followed by Tukey’s multiple comparison (n=3). (C) Uptake of Rhod-NPs; Rhod-NPs-Free (not incorporated into the NPs) and Free-Rhod in comparison with untreated cells at 3 hours.
Notes: Each value is the mean of three independent experiments. *P<0.05 by one way ANOVA and Tukey’s multiple comparison (n=3).
Abbreviations: FACS, fluorescence-activated cell sorting; hCMEC/D3, human brain microvascular endothelial cell line; Rhod-NPs, Rhod-nanoparticles; NS, not significant.
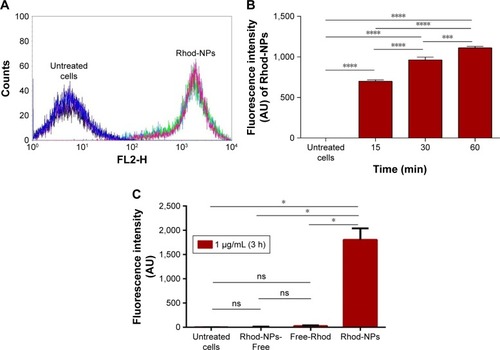
Figure 4 Cellular uptake and intracellular distribution of Rhod-NPs in hCMEC/D3. (A) hCMEC/D3 untreated (control); (B) hCMEC/D3 exposed to Free-Rhod and (C) hCMEC/D3 exposed to Rhod-NPs.
Notes: Cells were incubated for 3 hours with 1 µg/mL of NPs. Nuclei were counterstained with DAPI (blue).
Abbreviations: Rhod-NPs, Rhod-nanoparticles; hCMEC/D3, human brain microvascular endothelial cell line.
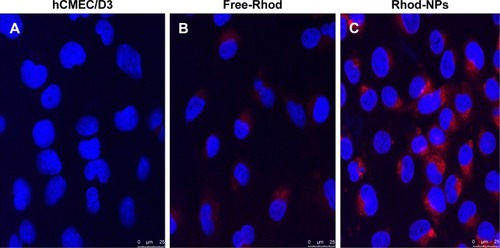
Figure 5 Localization of PGZ-NPs and Rhod-NPs in hCMEC/D3 by TEM.
Note: Cells exposed to 1 µg/mL for 6 hours.
Abbreviations: PGZ-NPs, PGZ-loaded nanoparticles; Rhod-NPs, Rhod-nanoparticles; hCMEC/D3, human brain endothelial cell line; TEM, transmission electron microscopy.
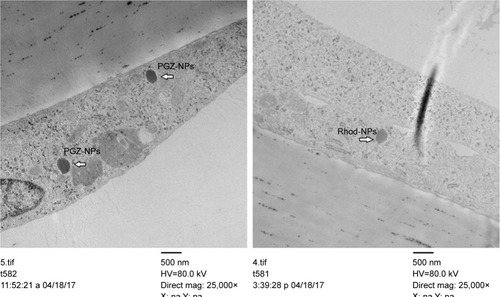
Figure 6 (A) Images of PGZ-NPs and Rhod-NPs by TEM after 6 hours in the basolateral compartment. (B) Permeability of hCMEC/D3, following exposure to 1 µg/mL of NPs for 6 hours. TNFα+ IFNγ (10 ng/mL, for 24 hours) was used as a positive control, increasing endothelial permeability.
Notes: Each value is the mean of three independent experiments. ns=nonsignificant, *P<0.05 by one-way ANOVA and Dunnett’s multiple comparison test (n=3).
Abbreviations: PGZ-NPs, PGZ-loaded nanoparticles; Rhod-NPs, Rhod-nanoparticles; hCMEC/D3, human brain endothelial cell line; TEM, transmission electron microscopy; TNFα, tumor necrosis factorα; IFNγ, interferon; Pe, permeability coefficient.
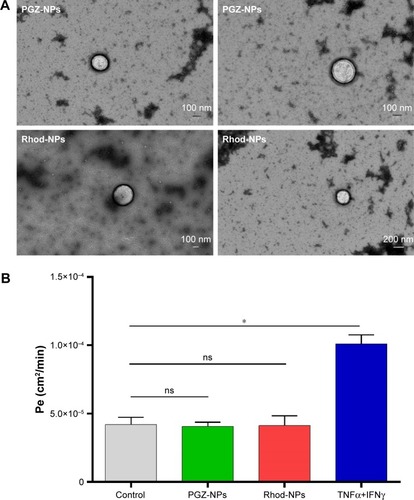
Figure 7 In vivo evaluation of PGZ-NPs.
Notes: (A) Memory performance of treated animals in the two-object recognition test. APP/PS1 animals treated with vehicle showed cognitive impairment when compared with wild-type littermates. In contrast, Free-PGZ and PGZ-NPs treatment reduced the memory impairment in APP/PS1 mice. (B) Cortical Aβ burden is not significantly modified in treated APP/PS1 mice, in spite of the tendency to decreased deposition in NP-PGZ-treated animals. (C) Representative images of Aβ immunoreactivity in cortical sections of APP/PS1 mice chronically treated with Free-PGZ, PGZ-NPs or vehicle. Scale bar=200 µm. Data are expressed as the mean ± SEM. **P<0.01 compared to WT animals. $P<0.05, $$P<0.01 compared to vehicle group.
Abbreviations: PGZ-NPs, PGZ-loaded nanoparticles; PGZ, pioglitazone; WT, wild-type; VEH, vehicle.
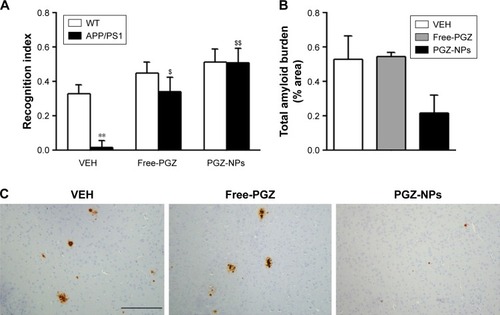
Figure S1 Design of experiments. Response surfaces of PGZ-NPs at Tw 80 1.16%, with different concentrations of PGZ and PLGA-PEG: (A) Zav, (B) PI, (C) ZP and (D) EE.
Abbreviations: PGZ-NPs, PGZ-loaded nanoparticles; PGZ, pioglitazone; PLGA-PEG, poly (lactic-co-glycolic acid) polyethylene glycol; Zav, average particle size; PI, polydisper-sity index; ZP, zeta potential; EE, entrapment efficiency.
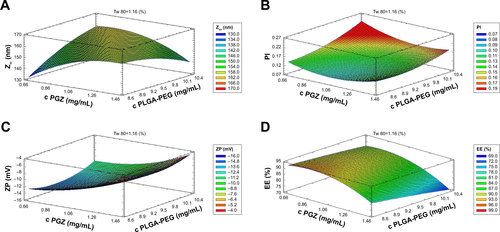
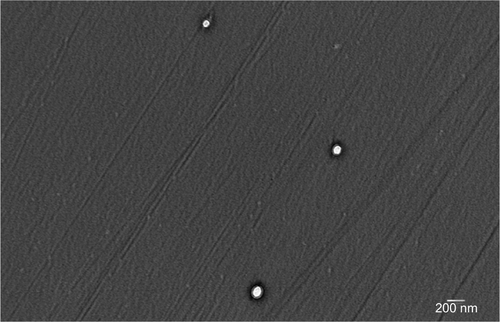
Figure S2 (A) Image of PGZ-NPs by TEM and (B) size of PGZ-NPs by dynamic light scattering.
Abbreviations: PGZ-NPs, PGZ-loaded nanoparticles; TEM, transmission electron microscopy.
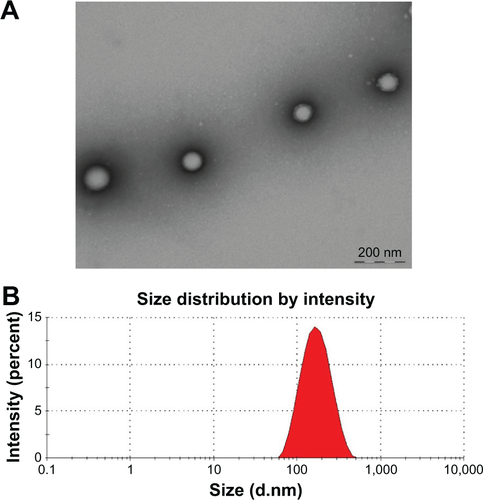
Figure S3 Transport in vitro assay in hCMEC/D3.
Note: PGZ-NPs on the basolateral surface (filter side) of the endothelium after 6 hours.
Abbreviations: PGZ-NPs, PGZ-loaded nanoparticles; hCMEC/D3, human brain endothelial cell line.