Figures & data
Figure 1 Fourier transform infrared spectra of polyethylene glycol-grafted polyethylenimine.
Note: A strong absorption around 1657 cm−1 attributed to the amide linkage appeared, and the strong and broad peak around 3400 cm−1 was attributed to the characteristic absorption of amines. These results indicated that polyethylene glycol was grafted on to polyethylenimine chains by amide linkage.
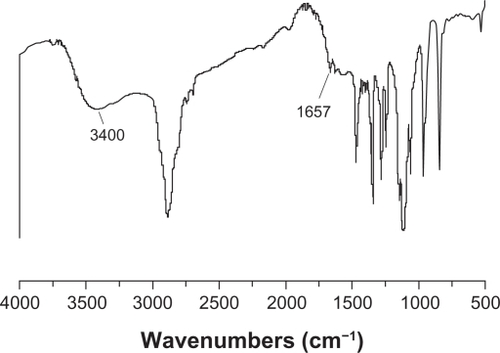
Figure 2 1H-NMR spectrum of PEG-PEI.
Note: PEG-PEI was synthesized by conjugating PEG-NHS onto polyethylenimine. 1H-NMR analysis of the dialyzed PEI-g-PEG revealed prominent chemical shifts of protons from polyethylene glycol (–OCH2CH2–, 3.65 ppm; CH3O–, 3.38 ppm) and polyethylenimine (–CH2CH2 NH–, 2.5–2.9 ppm), respectively, indicating that polyethylene glycol chains were successfully grafted onto polyethylenimine chains. Polyethylene glycol grafting density of polyethylenimine was 3.8, as characterized by 1H-NMR.
Abbreviations: 1H-NMR, Hydrogen-1 High resolution NMR; PEG-PEI, polyethylene glycol-grafted polyethylenimine; PEG-NHS, polyethylene glycol-N-hydroxysuccinimide.
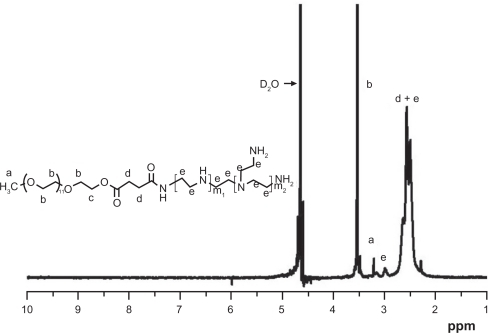
Figure 3 Influence of the viability of rat mesenchymal stem cells on PEG-PEI concentration and incubation time.
Note: The cells were treated with various concentrations of PEG-PEI for four, eight, 12, and 24 hours. Cell viability was determined by MTT assay. Incubated with PEG-PEI 14 μg/mL (corresponding to an N/P ratio of 40) for 4–8 hours, rat mesenchymal stem cells maintained high viability. The percentages of viable rat mesenchymal stem cells are shown. Values are the mean ± standard deviation (n = 3).
Abbreviations: PEG-PEI, polyethylene glycol-grafted polyethylenimine; rMSCs, rat mesenchymal stem cell.
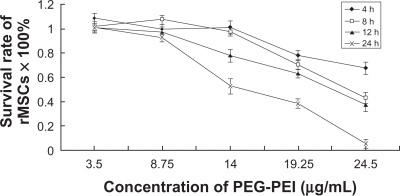
Figure 4 Wound and healing assay for rat mesenchymal stem cells.
Note: The confluent cells incubated with complete Dulbecco’s modified Eagle’s medium (A, B, C, D) or culture medium containing PEG-PEI 14 μg/mL (E, F, G, H) were scratched by a cell scraper (A, E), and cultured for two (B, F), four (C, G), or eight (D, H) hours. After scratching, the surrounding cells migrated into the scratched area (time after scratching is indicated; original magnification × 100). The time-dependent percentages of the residual scratched area were calculated under control conditions and in the presence of PEG-PEI 14 μg/mL. When incubated with PEG-PEI for less than four hours, the migration velocity of the rat mesenchymal stem cells displayed insignificant changes. Values are the mean ± standard deviation (n = 3 independent experiments).
*P < 0.05 for rat mesenchymal stem cells incubated with PEG-PEI over four hours versus control group.
Abbreviation: PEG-PEI, polyethylene glycol-grafted polyethylenimine.
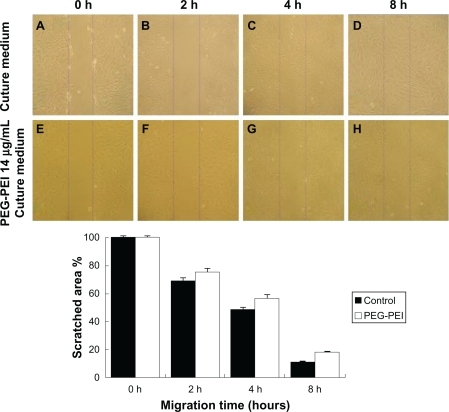
Figure 5 The multilineage potential of rat mesenchymal stem cells after incubation with the copolymer.
Note: After incubating with PEG-PEI 14 μg/mL for eight hours, rat mesenchymal stem cells were induced to differentiate into adipocytes (A red cells) and osteoblasts (B black cells). Original magnification × 400.
Abbreviation: PEG-PEI, polyethylene glycol-grafted polyethylenimine.
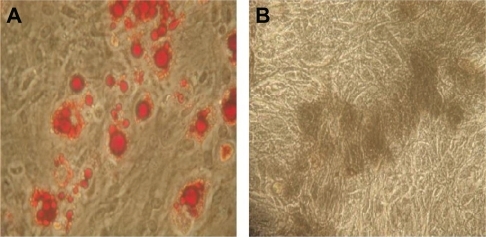
Figure 6 Electrophoretic migration and dynamic diameter distribution of PEG-PEI/EGFP-C1 nanoparticles at various N/P ratios.
Note: To condense 1 μg DNA, PEG-PEI/pEGFP-C1 complexes were prepared at a series of N/P ratios. A) Agarose gel electrophoresis image showing that PEG-PEI completely bound with pEGFP-C1 at an N/P ratio of 3. B) Dynamic diameter distribution showing that PEG-PEI condensed pEGFP-C1 to form nanoparticles in the 100–150 nm diameter range at an N/P ratio of 15. The particle diameters of the nanoparticles decreased further when the N/P ratio was over 10 and were stable when over 20. Values are the mean ± standard deviation (n = 3).
Abbreviations: PEG-PEI, polyethylene glycol-grafted polyethylenimine; EGFP, enhanced green fluorescent protein.
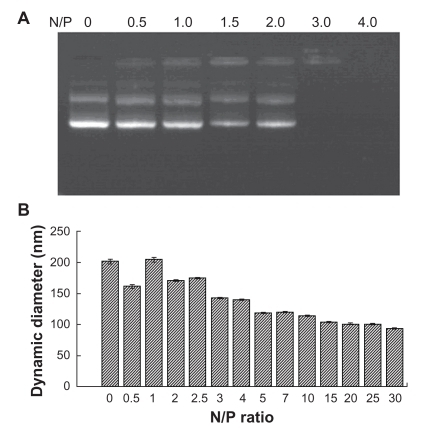
Figure 7 EGFP-C1 encapsulated by different carriers for gene delivery into rat mesenchymal stem cells.
Note: Fluorescence microscopy was used to observe the transfection efficiency of PEG-PEI-mediated plasmid delivery in rat mesenchymal stem cells. A) PEG-PEI and B) liposome. Typical samples of rat mesenchymal stem cells showed 8%–15% EGFP expression when incubated with cationic liposome/EGFP-C1 (D), and showed 15%–21% EGFP expression when incubated with PEG-PEI/pEGFP-C1 at the optimal N/P ratio of 40 (C). Original magnification × 100. The transfection efficiency tendency of rat mesenchymal stem cells incubated with cationic liposome/EGFP-C1 or PEG-PEI/EGFP-C1 at N/P ratios of 10, 20, 30, 40, and 50 are shown. An increase in the N/P ratio of PEG-PEI to DNA resulted in an increase of gene expression in rat mesenchymal stem cells, but the transfection efficacy degraded remarkably at an N/P ratio of 50. Values are the mean ± standard deviation (n = 3).
*P < 0.05 for N/P 40 versus N/P 10, 20, 30, and 50, and cationic liposome.
Abbreviations: EGFP, enhanced green fluorescent protein; FITC, Fluoreceine-isothiocyanate: PEG-PEI, polyethylene glycol-grafted polyethylenimine; rMSCs, rat mesenchymal stem cells; SSC, Side scatter.
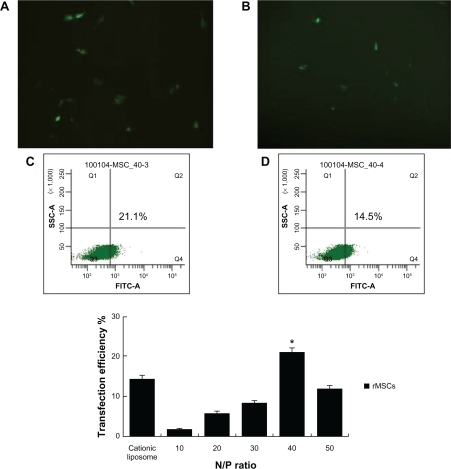
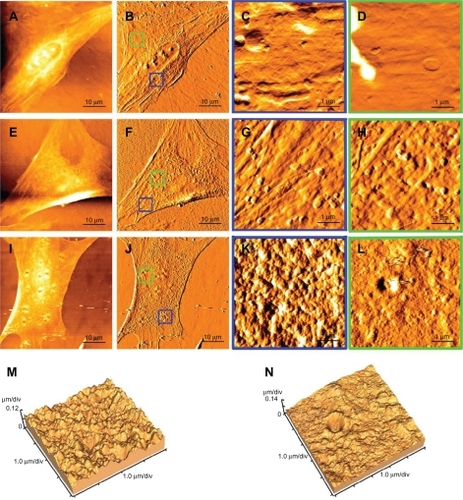
Figure 8 Cellular uptake of plasmid-encapsulated PEG-PEI microcapsules observed by atomic force microscopy.
Note: The samples were scanned in the range of 1–70 μm with a UL20B silicon probe on atomic force microscopy and analyzed by original software (IP2.1). The measurements were carried out in contact mode. Typical passage 4 rat mesenchymal stem cells comprised the controls (A, B), and the surface of the nuclear region and the boundary of the cell are relatively smooth (C, D). After six hours of plasmid-encapsulated PEG-PEI incubation, nanoparticles of 200–400 nm diameter adsorb onto the cell membrane (E, F). Some samples were washed with phosphate-buffered saline and cultured for another six hours. Some biggish hollows can be observed (G, H, I, and J). Simulation at three dimensions of (I and J) are showed in (K and L) separately.
Abbreviation: PEG-PEI, polyethylene glycol-grafted polyethylenimine.