Figures & data
Figure 1 Experimental setup of the microwave plasma instrument.
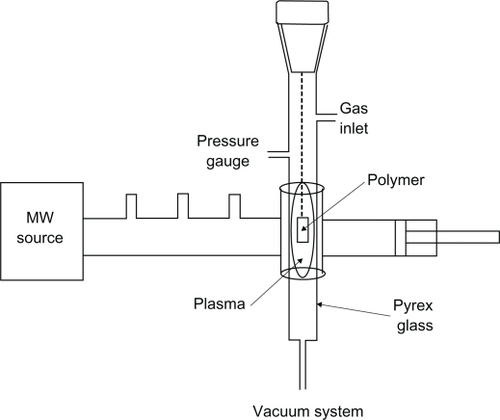
Figure 2 Spectra of attenuated total reflection Fourier transform infrared of normal polyurethane (A), polyurethane modified by oxygen plasma (B), and polyurethane modified by argon plasma (C).
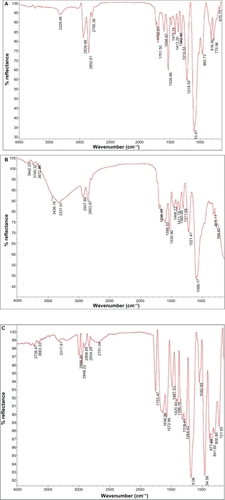
Figure 3 Topography of normal polyurethane.
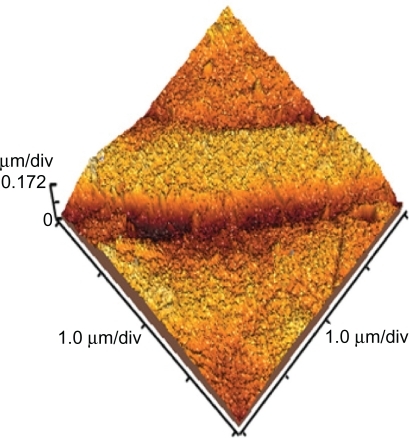
Figure 4 Topography of polyurethane modified by argon plasma for 30 seconds (A) and 60 seconds (B).
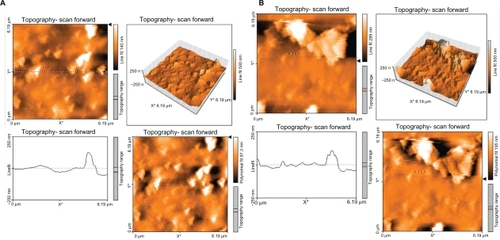
Figure 5 Topography of polyurethane modified by oxygen plasma for 30 seconds (A) and 60 seconds (B).
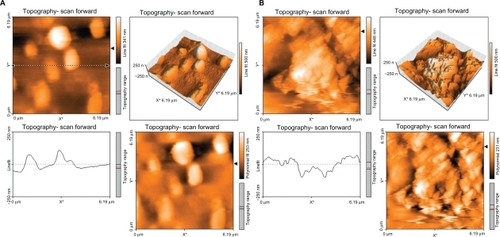
Table 1 Contact angles of normal and irradiated samples (average)
Table 2 MTT analysis of the samples
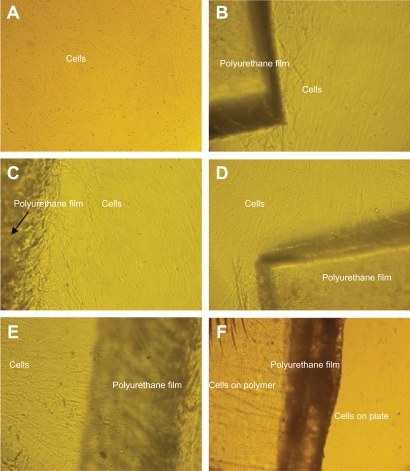
Figure 6 Unrestricted somatic stem cell culture on the (A) control (TCPS) surface, (B) normal polyurethane (PU), (C) PU modified by argon plasma (30 seconds), (D) PU modified by argon plasma (60 seconds), (E) PU modified by oxygen plasma (30 seconds), and (F) PU modified by oxygen plasma (60 seconds).