Figures & data
Figure 1 Schematic of O-PEGylated chitosan polymer preparation using NaH and THF: A) chitosan; B) deacetylated chitosan; C) phthaloyl chitosan; D) chlorinated phthaloyl chitosan intermediate; E) PEGylated phthaloyl chitosan; and F) PEGylated chitosan.
Abbreviations: NaH, sodium hydride; THF, tetrahydrofuran.
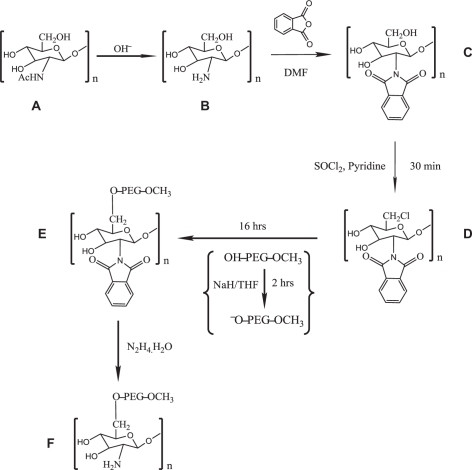
Figure 2 Fourier transform infrared spectra of the chitosan intermediates and O-PEGylated chitosan: A) deacetylated chitosan; B) phthaloylated chitosan: peaks at 1774 cm−1and 1702 cm−1. The OH groups of phthaloylated chitosan was chlorinated using thionyl chloride, represented by the reduction in peak: from 3500 to 3200 cm−1; C) OH-PEG-OCH3, M.W. 5,000; D) 6-O-PEG-g-2-N-phthaloyl chitosan; E) PEG-grafted chitosan: disappearance of peaks 1774 cm−1 and 1702 cm−1.
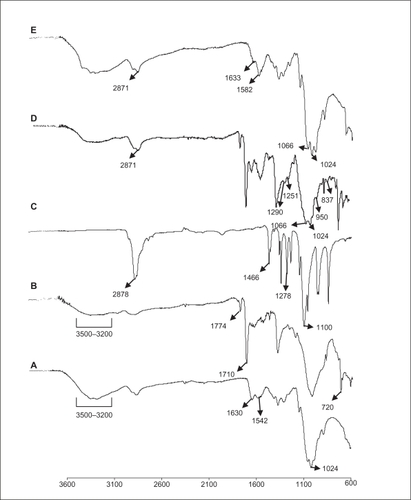
Figure 3 TEM images of a) PEGylated chitosan polymer (mag. 57,000×); b) chitosan–TPP nanoparticle (mag. 22,000×); c) PEGylated chitosan–TPP nanoparticle (mag. 57,000×) and d), PEGy lated chitosan-TPP nanoparticle (mag. 135000x).
Abbreviation: TPP, sodium tripolyphosphate.
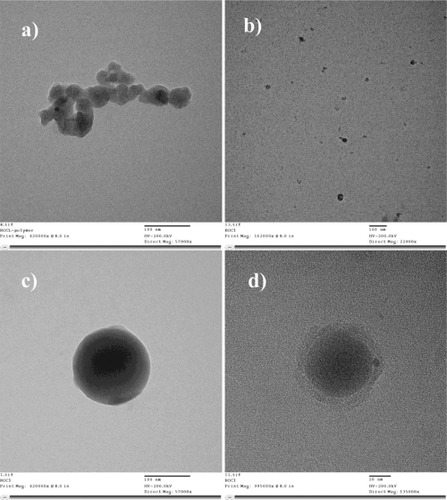
Figure 4 Gel retardation assay: lane 1) control 10 bp DNA ladder; lane 2 and 3 control siGLO, and lane 4 and 5 are PEGylated chitosan complexed siGLO at a ratio of 200:1 (w/w). In all groups the siGLO concentration was kept constant at 6 μg/mL. The disappearance of the band size at 40 bp in PEGylated chitosan complexed siGLO (lanes 4 and 5), compared to siGlO control (lanes 2 and 3), indicates the complete complexation of the siGLO.
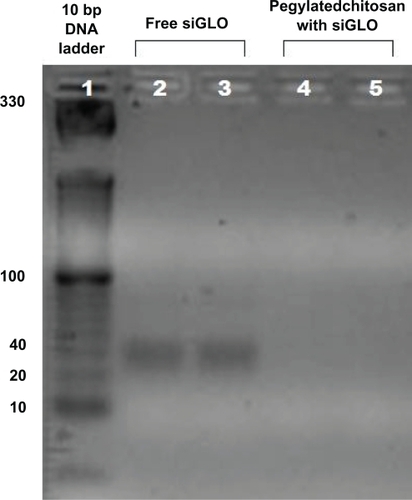
Figure 5 Transfection efficiency of nanoparticles on Neuro2a cells after 4 hours of incubation at 37°C and 5% CO2: a) PEGylated-chitosan-TPP:siGLO nanoparticles; b) chitosan-TPP:siGLO nanoparticles; c) siGLO only (negative control); d) chitosan-TPP nanoparticles (negative control); e) cells only (negative control)
Abbreviation: TPP, sodium tripolyphosphate.
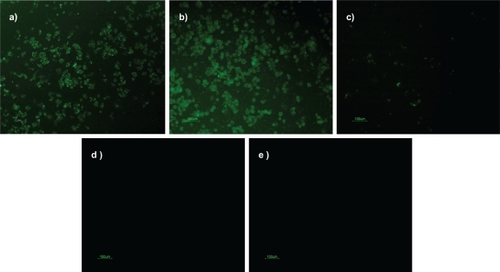
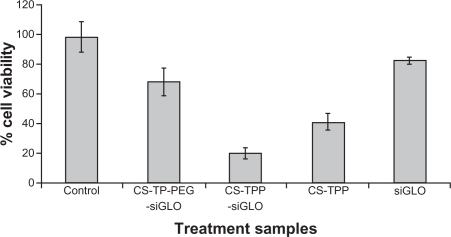
Figure 6 Designed CS-TPP-PEG-siGLO nanoparticle cytotoxicity was investigated using Neuro2a cells. For the experiment, various control nanoparticle formulations were used, the Neuro2a cells were exposed for 4 hours and cell viability was evaluated using spectrophotometer at 490 nm using standard MTS assays (n = 3).