Figures & data
Figure 1 The macroscopic and surface topography images.
Note: HA (A, D), EMC (B, E), and IMC (C, F) visualized by SEM and AFM, individually.
Abbreviations: AFM, atomic force microscopy; EMC, extrafibrillar mineralized collagen; HA, nano-hydroxyapatite; IMC, intrafibrillar mineralized collagen; SEM, scanning electron microscopy.
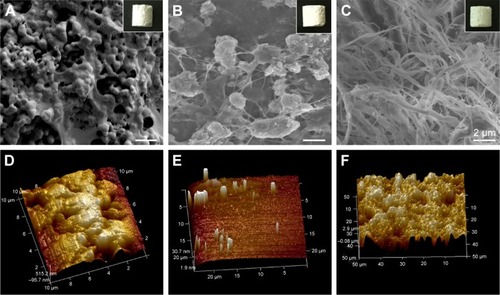
Figure 2 Surgical procedures.
Notes: (A) Critical-sized defects created on a rat femur. (B) Bone scaffold materials implanted into the defect.
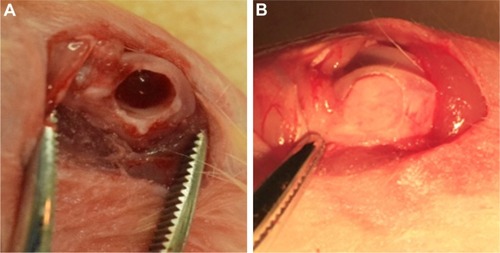
Table 1 Primers for qRT-PCR
Figure 3 Analysis of in vivo bone regeneration effects of different bone scaffold materials.
Notes: (A) Representative µ-CT and HE staining images of defect regions after implantation with blank, HA, EMC, and IMC scaffolds for 10 weeks. (B) New BV relative to the TV within the defect region from different groups based on µ-CT analysis. (C) Semiquantitative analysis of new bone based on histologic examination. *P<0.05 vs IMC; &P<0.05 vs EMC; #P<0.05 vs all of the other groups.
Abbreviations: µ-CT, micro-computed tomography; BV, bone tissue volume; EMC, extrafibrillar mineralized collagen; HA, nano-hydroxyapatite; IMC, intrafibrillar mineralized collagen; NB, new bone; OB, old bone; S, scaffold materials; TV, total tissue volume; F, fibrous tissue.
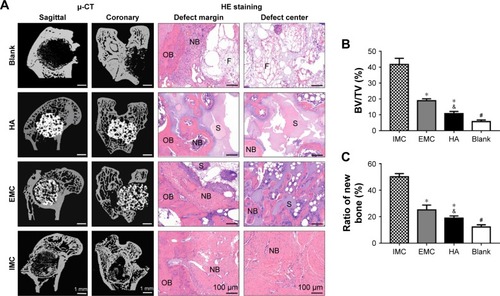
Table 2 Numbers of differentially expressed genes at days 7 and 14
Figure 4 The volcano plots of differentially expressed genes between IMC and blank groups.
Notes: (A) At day 7. (B) At day 14. Red points indicate mRNAs with a fold change of ≥2.0 and a P-value ≤0.05. Blue points indicate mRNAs with a fold change of ≤2.0 and a P-value of ≤0.05.
Abbreviation: IMC, intrafibrillar mineralized collagen.
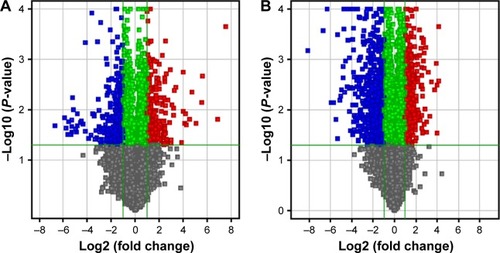
Table 3 Overexpressed GO categories of biological processes at day 7
Table 4 Overexpressed GO terms of biological processes at day 14
Table 5 List of differentially expressed genes (P<0.05) belonging to functionally relevant GO terms (positive value indicates upregulated genes)
Table 6 Immunohistochemical analysis of positively stained cells in the defects region
Figure 5 Immunohistochemical analysis of positively stained cells in the defect regions of different groups.
Notes: (A) At day 7. (B) At day 14. (C) The sham surgery group without primary antibody was used as a NC. Black arrows indicate positively stained cells.
Abbreviations: EMC, extrafibrillar mineralized collagen; HA, nano-hydroxyapatite; IMC, intrafibrillar mineralized collagen; NC, negative control; OB, old bone; S, scaffold materials.
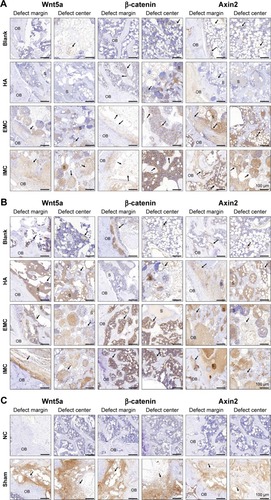
Figure 6 In vitro osteogenic differentiation capacity of rBMSCs on different materials.
Notes: (A) Primary rBMSCs. (B) rBMSCs of passage 3. (C) Flow cytometric analysis of rBMSCs. (D) ALP activity assay after coculture for 7 and 14 days. (E) ARS staining of rBMSCs cultured on HA, EMC, and IMC for 21 days. *P<0.05 vs HA, #P<0.05 vs EMC.
Abbreviations: ALP, alkaline phosphatase; ARS, alizarin red S; EMC, extrafibrillar mineralized collagen; HA, nano-hydroxyapatite; IMC, intrafibrillar mineralized collagen; rBMSCs, rat bone marrow-derived mesenchymal stem cells.
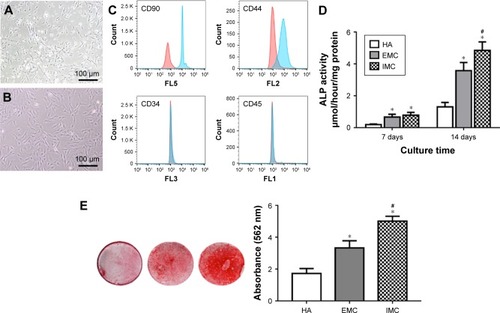
Figure 7 qRT-PCR for specific gene expression.
Notes: Fold change in expression of Wnt5a, β-catenin, and Axin2 on different materials after coculture for 3 and 7 days. *P<0.05 vs HA, #P<0.05 vs EMC.
Abbreviations: EMC, extrafibrillar mineralized collagen; HA, nano-hydroxyapatite; IMC, intrafibrillar mineralized collagen; qRT-PCR, quantitative real-time transcription polymerase chain reaction.
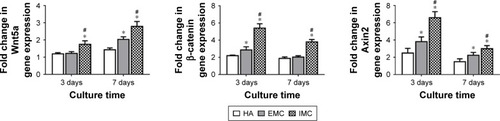
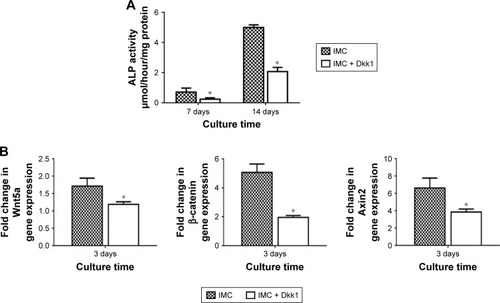
Figure 8 Evaluation of rBMSCs on IMC scaffolds with the Wnt signaling pathway inhibitor Dkk1.
Notes: (A) ALP activity assay at days 7 and 14. (B) Fold change in expression of Wnt5a, β-catenin, and Axin2 at day 3. *P<0.05 vs IMC.
Abbreviations: ALP, alkaline phosphatase; Dkk1, Dickkopf-1; IMC, intrafibrillar mineralized collagen; rBMSCs, rat bone marrow-derived mesenchymal stem cells.