Figures & data
Figure 1 Experimental setup of microwave-plasma apparatus.
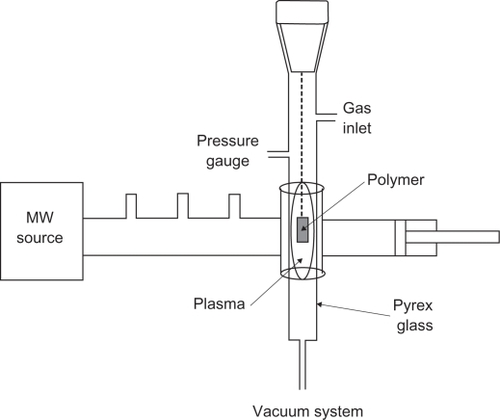
Figure 2 A) Attenuated total reflection Fourier transform infrared spectra for normal polystyrene, B) polystyrene irradiated by argon plasma, and C) polystyrene irradiated by oxygen plasma.
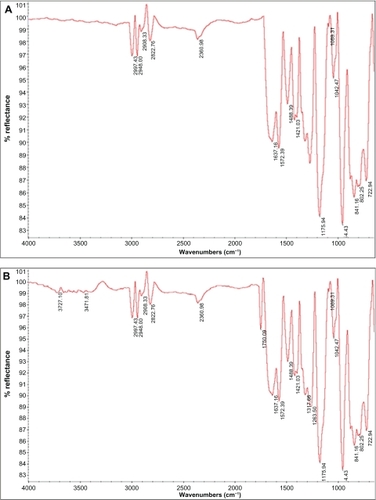
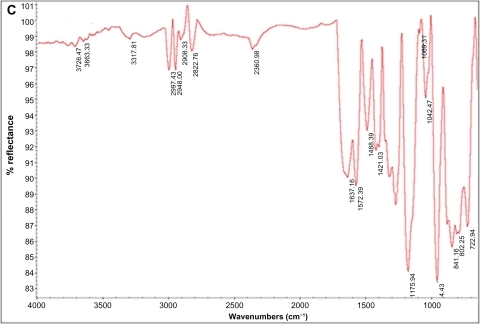
Figure 3 Topography of normal polystyrene.
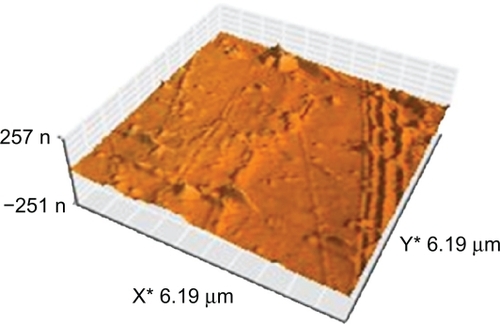
Figure 4 Topography of irradiated polystyrene by argon plasma at A) 30 seconds, B) 60 seconds, and C) 180 seconds.
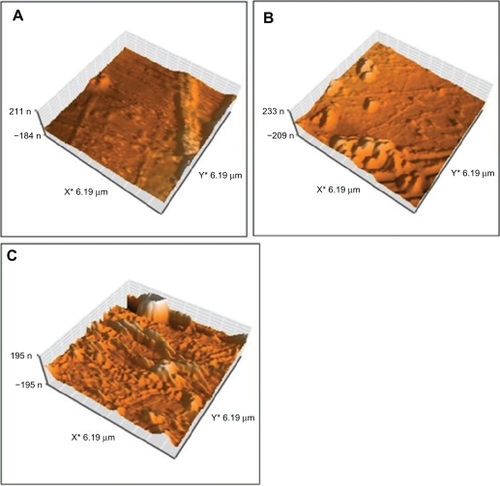
Figure 5 Topography of irradiated polystyrene by oxygen plasma at A) 30 seconds, B) 60 seconds, and C) 180 seconds.
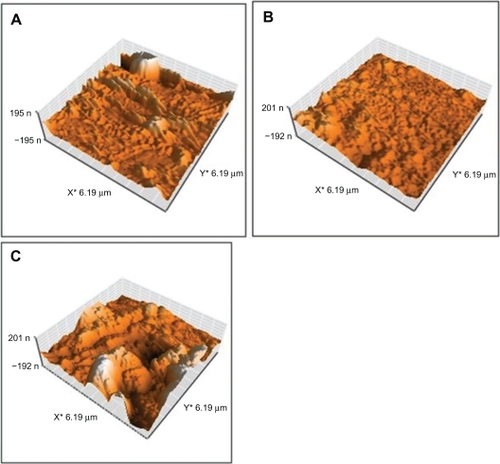
Table 1 Surface roughness of normal and irradiated samples
Table 2 Contact angles of normal and irradiated samples
Figure 6 Morphology of unrestricted somatic stem cells: Spindle-shaped cells sized 20–25 μm.
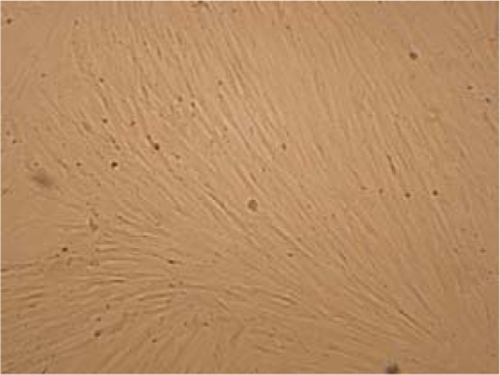
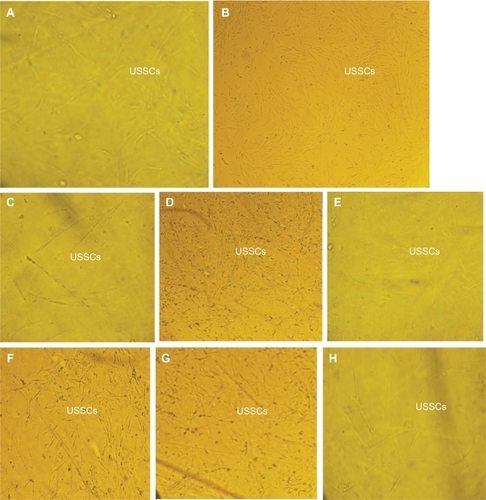
Figure 7 Markers of flow cytometric analysis performed on unrestricted somatic stem cells. Before beginning the experiments, karyotype analysis was performed on unrestricted somatic stem cells of passage 2, revealing a normal 44, XX karyotype. After 48 passages, these cells were subjected to karyotype analysis once again, and they were shown to have a normal chromosome karyotype of 44, XX (see ).
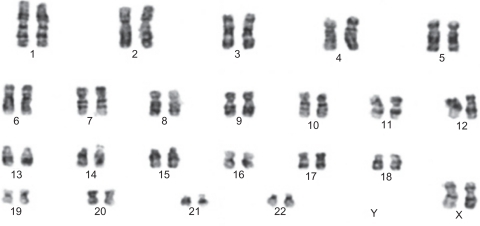
Figure 8 Chromosome karyotype analysis performed on unrestricted somatic stem cells.
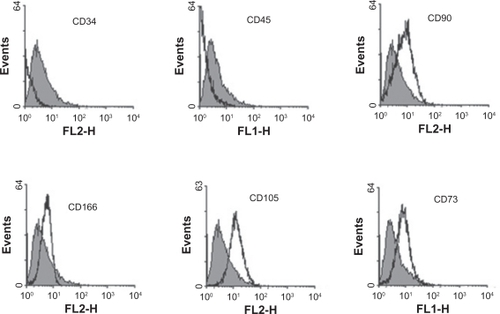
Table 3 MTT analysis of the samples
Figure 9 Unrestricted somatic stem cell culture on A) normal (untreated polystyrene), B) control surfaces, C) polystyrene treated with argon plasma for 30 seconds, D) polystyrene treated with argon plasma for 60 seconds, E) polystyrene treated with argon plasma for 180 seconds, F) polystyrene treated with oxygen plasma for 30 seconds, G) polystyrene treated with oxygen plasma for 60 seconds, and H) polystyrene treated with oxygen plasma for 180 seconds.