
Figures & data
Figure 1 MTS signal for human dermal fibroblasts (HDFs) pre-incubated with selenium nanoparticles (SeNP) or normal cell culture medium against stressor challenges of: (A) normal cell culture medium, (B) 0.2% FBS-DMEM, and (C) 150 μM hydroquinone (HQ). (D) Effect of SeNP dosing at pre-incubation for protecting against HQ challenge. Cells were assessed at 24, 48, and 72 hrs. All tests were conducted in triplicate, N=3. Data = mean ± standard deviation. Respective indications for * appear at the top of each figure.
Abbreviation: NS, not significant.
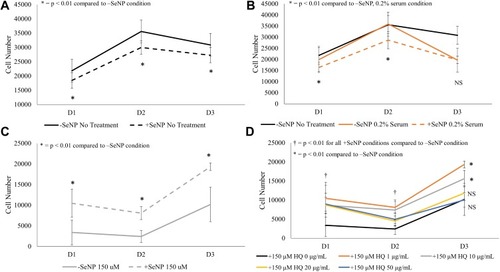
Figure 2 Phase contrast images for human dermal fibroblasts (HDFs) with a normal DMEM growth medium challenge at 12 and 48 hrs. 10× magnification. (A): –SeNP/12 hrs; (B) –SeNP/48 hrs; (C) +SeNP/12 hrs; (D) +SeNP/48 hrs. Scale bars = 100 microns.
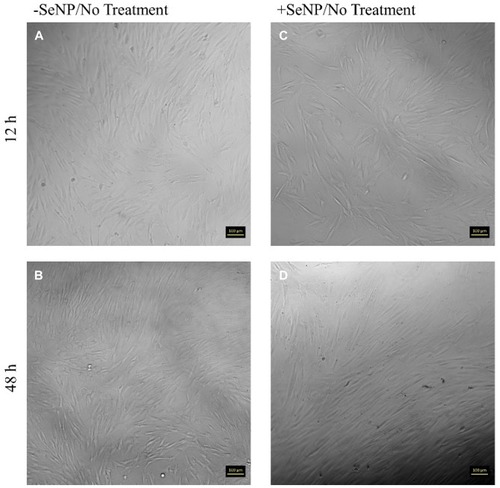
Figure 3 Live/dead images (calcein AM/ethidium homodimer-1) for human dermal fibroblasts (HDFs) with normal DMEM growth medium challenge at 12 and 48 hrs. 10× magnification. (A): –SeNP/12 hrs; (B) –SeNP/48 hrs; (C) +SeNP/12 hrs; (D) +SeNP/48 hrs. Scale bars = 100 microns.
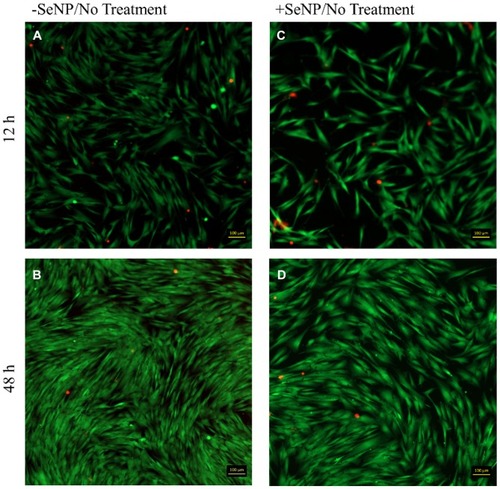
Figure 4 Phase contrast images for human dermal fibroblasts (HDF) with 150 μM HQ challenge at 12 and 48 hrs. 10× magnification. (A): –SeNP/12 hrs; (B) –SeNP/48 hrs; (C) +SeNP/12 hrs; (D) +SeNP/48 hrs. Scale bars = 100 microns.
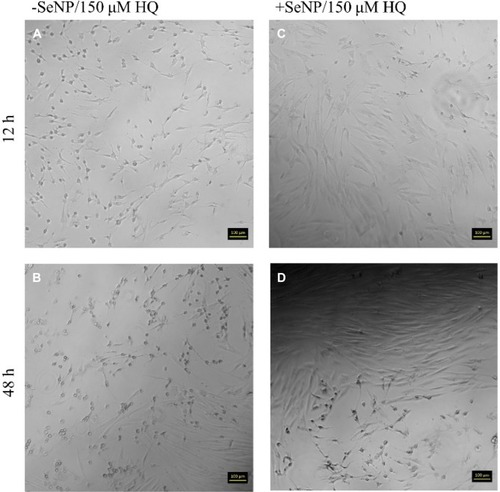
Figure 5 Live/dead images (calcein AM/ethidium homodimer-1) images for human dermal fibroblasts (HDFs) with 150 μM HQ challenge at 12 and 48 hrs. 10× magnification. (A): –SeNP/12 hrs; (B) –SeNP/48 hrs; (C) +SeNP/12 hrs; (D) +SeNP/48 hrs. Scale bars = 100 microns.
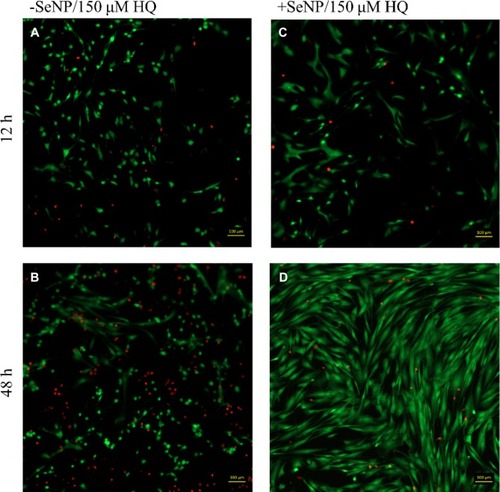
Figure 6 Phase contrast images for human dermal fibroblasts (HDFs) with 0.2% FBS-DMEM challenge at 12 and 48 hrs. 10× magnification. (A): –SeNP/12 hrs; (B) –SeNP/48 hrs; (C) +SeNP/12 hrs; (D) +SeNP/48 hrs. Scale bars = 100 microns.
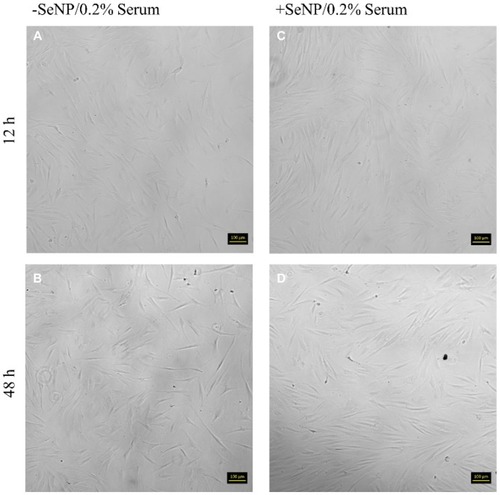
Figure 7 Live/dead images (calcein AM/ethidium homodimer-1) images for human dermal fibroblasts (HDFs) with 0.2% FBS-DMEM challenge at 12 and 48 hrs. 10× magnification. (A): –SeNP/12 hrs; (B) –SeNP/48 hrs; (C) +SeNP/12 hrs; (D) +SeNP/48 hrs. Scale bars = 100 microns.
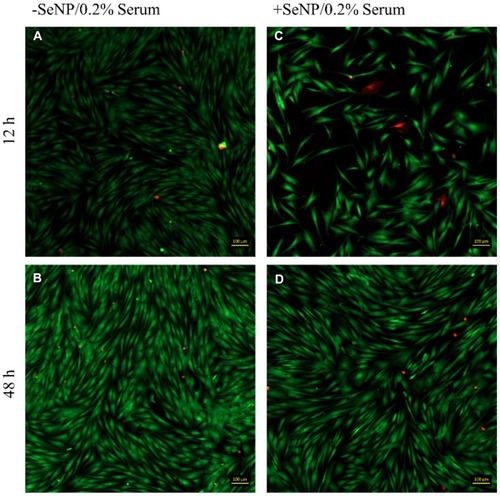
Figure 8 Intracellular ROS was measured by the CM-H2DCFDA kit and measured 6, 12, 24, 48, and 72 hrs after treatment with stressor conditions: (A) = no treatment; (B) = 0.2% serum; and (C) = 150 μM hydroquinone (HQ). The fluorescent signal was normalized to the no selenium nanoparticle (SeNP) incubation/no treatment cells. N = 3, triplicates. Data = mean ± standard deviation. *p < 0.05 compared to –SeNP condition.
Abbreviation: NS, not significant.
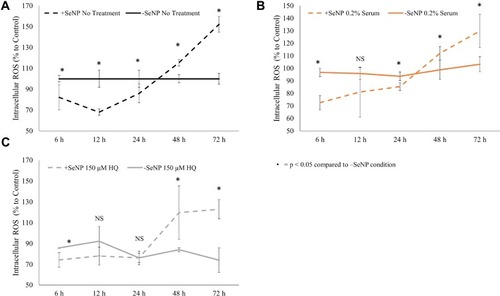
Figure 9 Relative quantification (RQ) of ATF4, BAD, Bcl-xL, HSP70, and SOD2 at12 and 48 hrs. GAPDH was the endogenous gene control and the –SeNP/no treatment condition was the reference sample. (A) The 12 hrs RQ for no-treatment condition, (B) 150 μM HQ condition, and (C) 0.2% fetal bovine serum (FBS) and the 48 hrs RQ for (D) no-treatment condition, (E) 150 μM HQ condition, and (F) 0.2% FBS. N = 3, triplicates. Data = mean ± standard deviation. Respective indications for * appear at the top of each figure.
Abbreviation: NS, not significant.
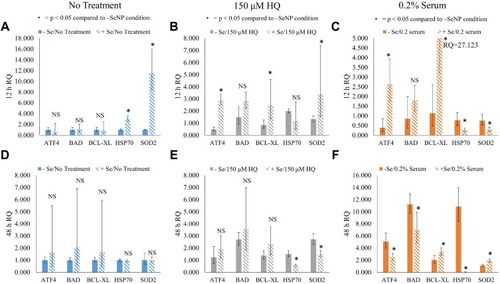
Table 1 Summation of Significant Changes in Gene Expression of Cells with Selenium Nanoparticle (SeNP) Pre-Incubation Compared with Cells with No SeNP