Figures & data
Figure 1 Mouse-immunization schedule.
Notes: Female C57BL/6J mice 6–8 weeks old were immunized intraperitoneally with 100 µL of blank NPs (11.6 mg), H1 protein (50 µg), 1H1-NPs (50 µg H1 in 11.6 mg PLGA) and BCG (105 CFUs/mice). H1-specific total IgG and subtype (IgG1 and IgG2a) titers were measured from sera of mice (n=8) by ELISA on days 14, 28, and 42 postimmunization. On day 43, three mice from each group were sacrificed, their splenocytes cultured, and different cytokines released in the culture supernatant were measured upon antigen stimulation. All mice were challenged witĥ5.7×10⁴ CFUs/mouse with Mtb H37Rv after 8 weeks of immunization. Five weeks postchallenge, lung and spleen bacterial load was enumerated in each mouse group (n=3). For enumeration of mean survival time, the remaining mice (n=12) were observed for the next 250 days.
Abbreviations: NPs, nanoparticles; PLGA, poly(lactic-co-glycolic acid); BCG, bacillus Calmette–Guérin.
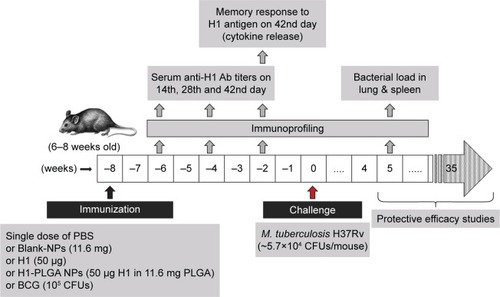
Figure 2 In vitro release profile of H1 protein from H1 NPs.
Notes: (A) H1 NPs suspended in PBS (50 mg/mL, pH 7.4) were incubated at 37°C for indicated time periods, and the release of H1 fusion protein was estimated by micro-BCA assay. The experiment was done in triplicate. The initial burst release caused >40% of the fusion protein to be released within 12 hours (inner graph), followed by slower-release kinetics that reached ~90% of fusion-protein release by 32 days (outer graph). (B) The purified recombinant H1 protein from H1 expressing Escherichia coli cells (Ni–nitrilotriacetic acid chromatography) that was used for or the preparation of H1 NPs by water-oil-water method (middle lane). The protein recovered from H1 NPs after 32 days of in vitro release (right lane) and protein molecular weight ladder (left lane) were subjected to 10% SDS-PAGE followed by Coomassie blue staining.
Abbreviation: NPs, nanoparticles.
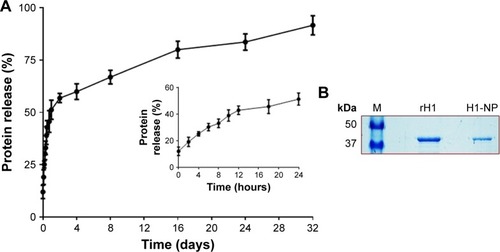
Figure 3 Physical characterization of H1 NPs.
Notes: (A) SEM; (B) TEM; (C) dynamic light scattering; (D) ζ-potential analysis.
Abbreviations: NPs, nanoparticles; SEM, scanning electron microscopy; TEM, transmission electron microscopy; PDI, polydispersity index.
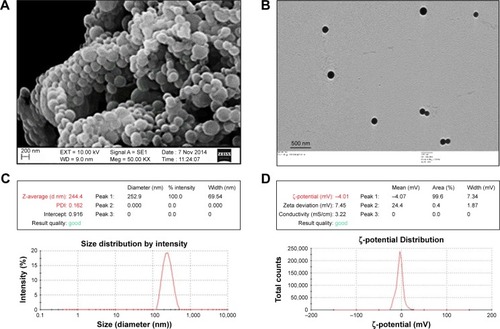
Figure 4 Confocal microscopy analysis of H1 FITC–NP internalization by THP1 macrophages.
Notes: (A) Untreated control DAPI-stained THP1 cells; (B) H1 FITC–PLGA NPs treated for 4 hours and DAPI-stained THP1 cells at 600× magnification and (C) at 900× magnification in different fields showing internalized particles.
Abbreviations: FITC, fluorescein isothiocyanate; NP, nanoparticle; PLGA, poly(lactic-co-glycolic acid).
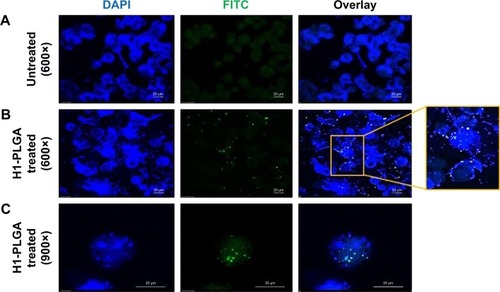
Figure 5 Anti-H1 antibody profile of mice immunized with, PBS, BLANK-NP, H1 and H1-NP.
Notes: Mice (n=8) were bled on days 14, 28, and 42 postimmunization, and anti-H1 specific total IgG, IgG1, and IgG2a end-point titers were determined by ELISA. (A–C) Anti-H1 IgG end-point titers of each mouse group on days 14, 28, and 42, respectively; (D–F) anti-H1 IgG1 end-point titers of each mouse group on days 14, 28, and 42, respectively; (G–I) anti-H1 IgG2a end-point titers of each mouse group on days 14, 28, and 42, respectively. Each point represents the mean of triplicate values of individual mice, and the bars represent means ± SEM of all mice in a group.
Abbreviations: PLGA, poly(lactic-co-glycolic acid); NPs, nanoparticles; NS, not significant.
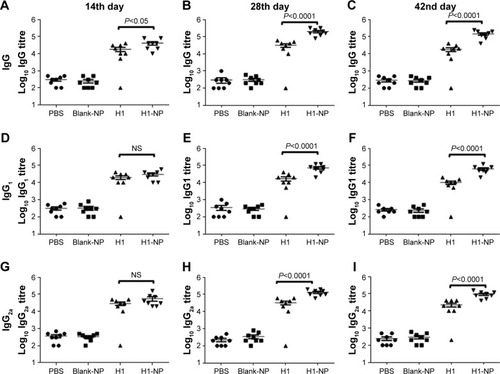
Figure 6 Cytokine release in splenocyte-culture supernatant upon in vitro stimulation with H1 antigen.
Notes: Six weeks after immunization, spleens were isolated from mice (n=3) from each group and cultured. IFNγ, TNFα, IL4, and IL10 levels were measured in H1 (10 µg/mL) in vitro–stimulated spleen cell–culture supernatant after 72 hours. Concentrations of (A) IFNγ, (B) TNFα, (C) IL4, and (D) IL10 were examined by ELISA. Concentration values expressed as means ± SE of three mice for each group of mice.
Abbreviation: NPs, nanoparticles.
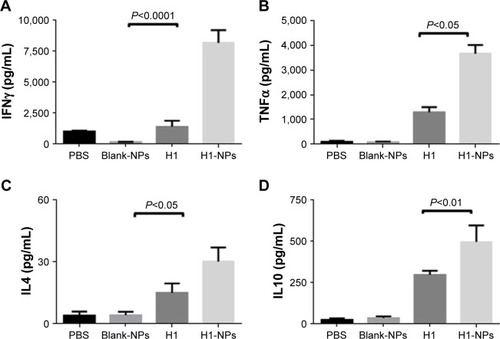
Figure 7 Enumeration of bacillary load in lung and spleen post–Mtb H37Rv challenge.
Notes: Eight weeks after vaccination, mice were challenged witĥ5.7×10⁴ CFU of virulent Mtb/mouse. At 5 weeks postchallenge, the mice were sacrificed and bacterial load (CFU) enumerated in the lungs and spleens of three mice/group. (A) Log10 CFU in lung; (B) log10 CFU in spleen.
Abbreviations: Mtb, Mycobacterium tuberculosis; NPs, nanoparticles; NS, not significant; BCG, bacillus Calmette–Guérin.
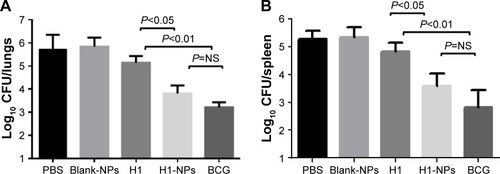
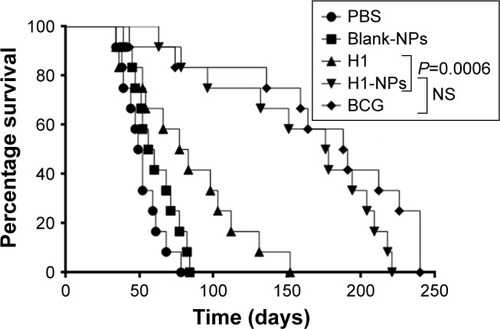
Figure 8 Survival of mice post–Mtb H37Rv challenge.
Note: Mtb H37Rv–challenged mice (n=12/group) were observed for 250 days for their surviving ability and calculation of their mean survival time (MST).
Abbreviations: Mtb, Mycobacterium tuberculosis; NPs, nanoparticles; NS, not significant; BCG, bacillus Calmette–Guérin; MST, mean survival time.