Figures & data
Table 1 Diameter of FT9110 and CNH particles used in the experiments
Table 2 Zeta potential of FT9110 and CNH particles used in the experiments
Figure 1 Viability of RAW264 cells exposed to FT9110.
Notes: In (A), the cell viability was measured with FT9110 after 24 hours. In (B), the cell viability was measured with FT9110 after 48 hours. (A, B): FT9110 was dispersed in FBS or PS at 100 µg/mL. The control was medium containing each dispersant only. Data are expressed as mean ± SE (n=6). *P<0.05; **P<0.01.
Abbreviations: FT9110, Flotube 9110; PS, polysorbate 80; SE, standard error.
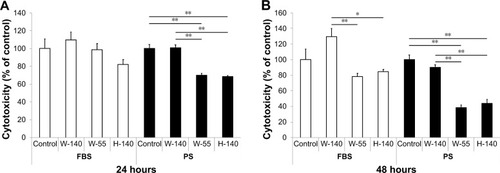
Figure 2 Live cells imaged after incubation with bisbenzimide H33342 fluorochrome trihydrochloride for nuclear staining.
Notes: (A) Control; (B) W-140; (C) W-55; (D) H-140. (B–D) RAW264 cells exposed to FT9110 at 100 µg/mL in 0.1% PS-DPBS. The control was medium containing each dispersant only.
Abbreviations: DPBS, Dulbecco’s PBS; FT9110, Flotube 9110; PS, polysorbate 80.
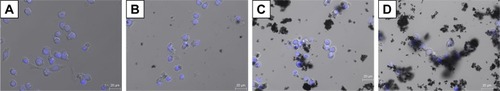
Figure 3 Live cells imaged after incubation with bisbenzimide H33342 fluorochrome trihydrochloride for nuclear staining and Cyto Painter Lysosomal Staining ab for lysosomes in dispersant (0.1% PS-DPBS and 2% FBS-DPBS).
Notes: (A, D) Control. RAW264 cells exposed to (B, E) FT9110 at 100 µg/ml and (C, F) CNHs at 100 µg/ml. (A–C) RAW264 cells in 0.1% PS-DPBS and (D–F) RAW264 cells in 2% FBS-DPBS. The control was medium containing each dispersant only.
Abbreviations: CNH, carbon nanohorn; DPBS, Dulbecco’s PBS; FT9110, Flotube 9110; PS, polysorbate 80.
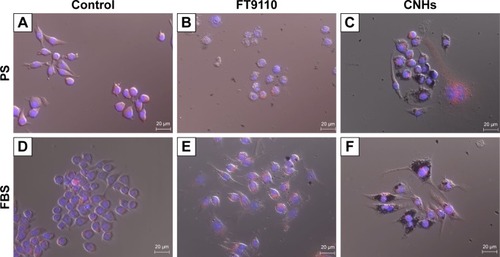
Figure 4 Uptake of FT9110 by RAW264 cells, as demonstrated by flow cytometry.
Notes: Cultured RAW264 cells were exposed to FT9110 at 10 µg/mL. The control was medium containing each dispersant only. Data are expressed as mean ± SE (n=3). **P<0.01.
Abbreviations: FT9110, Flotube 9110; PS, polysorbate 80; SE, standard error; SSC, side scatter.
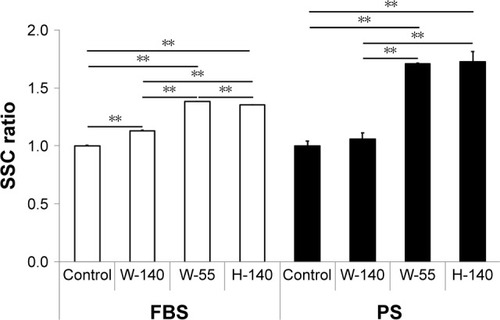
Figure 5 Transmission electron micrographs of RAW264 cells exposed to 100 µg/mL FT9110 and CNH uptake in dispersant (0.1% PS-DPBS).
Notes: (A, B) Control, RAW264 cells exposed (C, D) FT9110 sonicated by W-140, (E, F) FT9110 sonicated by W-55. (G, H) CNHs sonicated by W-140. (A, C, E, G) Low magnification images. Scale bars correspond to 1 µm. (B, D, F, H) High magnification images. Scale bars correspond to 500 nm. The control was medium containing dispersant only. Yellow arrows indicate (C–F) FT9110 and (G, H) CNHs. Blue Ns indicate nuclei.
Abbreviations: CNH, carbon nanohorn; DPBS, Dulbecco’s PBS; FT9110, Flotube 9110; PS, polysorbate 80.
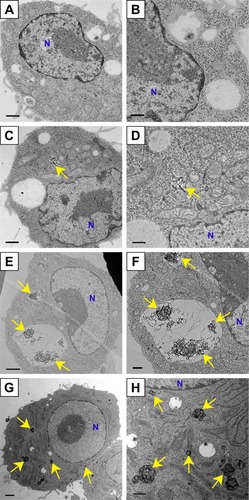
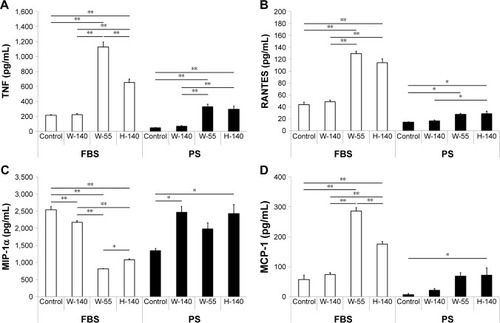
Figure 6 Measurement of inflammatory cytokine secretion by RAW264 cells after FT9110 exposure.
Notes: Cultured RAW264 cells were exposed to FT9110 at 10 µg/mL. After 24 hours, levels of cytokine and chemokine secretion were analyzed. (A) TNF. (B) RANTES. (C) MIP-1α. (D) MCP-1. The control was medium containing each dispersant only. Data are expressed as mean ± SE (n=3). *P<0.05; **P<0.01.
Abbreviations: FT9110, Flotube 9110; MCP, monocyte chemotactic protein; MIP, macrophage inflammatory protein; PS, polysorbate 80; RANTES, regulated upon activation normal T cell expressed and secreted; SE, standard error; TNF, tumor necrosis factor.