Figures & data
Figure 1 (A) The φ 3.5× (20–22) mm stainless-steel screw and (B) n-CDHA/PAA screw.
Abbreviation: n-CDHA/PAA, nano-calcium-deficient hydroxyapatite/poly-amino acid.
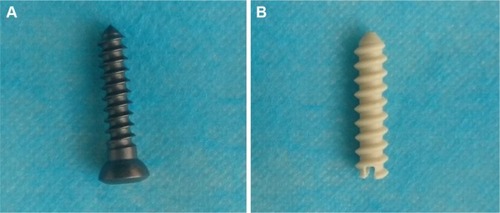
Figure 2 (A) The intercondylar fracture model of the femur; (B) control group was fixed with metal screw; and (C) experimental group was fixed with n-CDHA/PAA screw.
Note: Gray arrow indicates the metal screw cap and blue arrow indicates the n-CDHA/PAA screw cap.
Abbreviation: n-CDHA/PAA, nano-calcium-deficient hydroxyapatite/poly-amino acid.
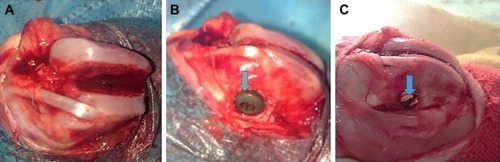
Table 1 The adjusted OAS system
Figure 3 The axial push-out test diagram.
Notes: (A) Push bin; (B) methyl methacrylate cement (including the harvested distal femoral condyle); and (C) clamp.
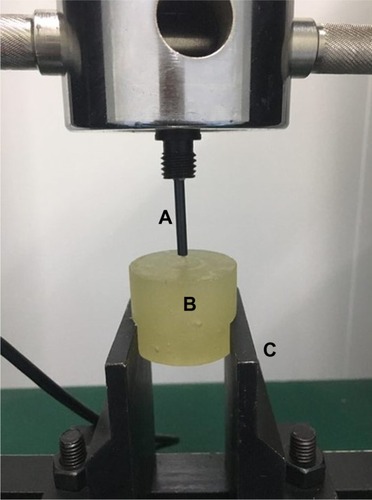
Figure 4 The specimen of harvested distal femoral condyles at 4 (A), 8 (B), and 12 (C) weeks after surgery in the control group; the specimen of harvested distal femoral condyles at 4 (D), 8 (E), and 12 (F) weeks after surgery in the experimental group.
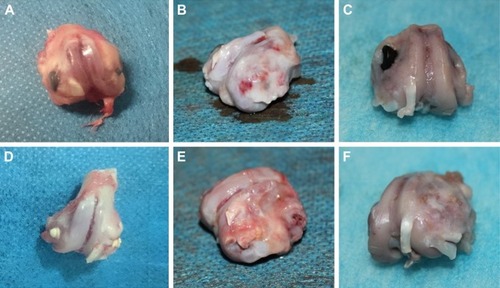
Figure 5 (A) The X-ray results at 4 weeks after surgery in the control group (a, anteroposterior view; b, lateral view) and in the experimental group (c, anteroposterior view; d, lateral view). (B) The X-ray results at 8 weeks after surgery in the control group (a, anteroposterior view; b, lateral view) and in the experimental group (c, anteroposterior view; d, lateral view). (C) The X-ray results at 12 weeks after surgery in the control group (a, anteroposterior view; b, lateral view) and in the experimental group (c, anteroposterior view; d, lateral view).
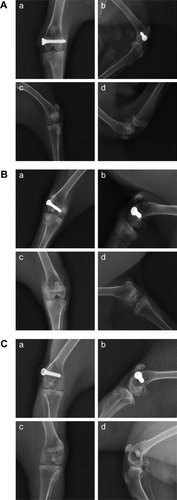
Figure 6 The Lane-Sandhu scores in the control and experimental groups.
Note: *P>0.05, compared with control group (n=5).
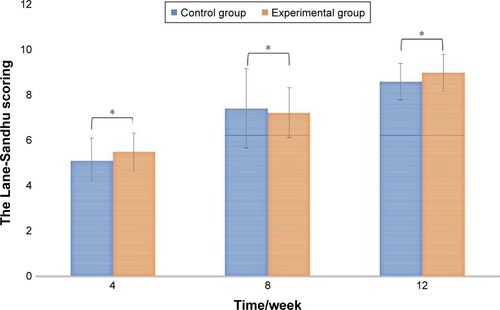
Figure 7 The range of motion of knee joints in the control and experimental groups.
Note: *P>0.05, compared with control group (n=5).
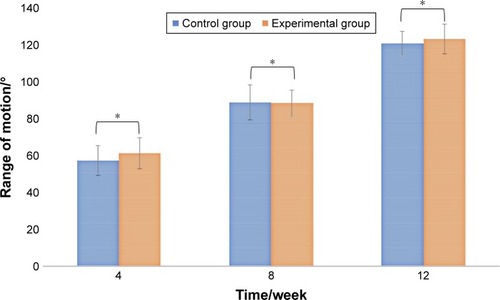
Table 2 The results of adjusted OAS for femoral intercondylar fracture
Figure 8 The results of push-out strength in the control and experimental groups.
Note: *P<0.01, #P>0.05, compared with control group (n=5).
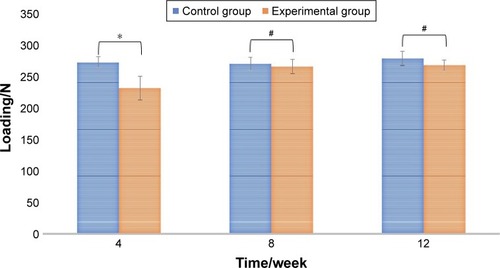
Figure 9 The weight loss of n-CDHA/PAA screw in vivo (n=5).
Abbreviation: n-CDHA/PAA, nano-calcium-deficient hydroxyapatite/poly-amino acid.
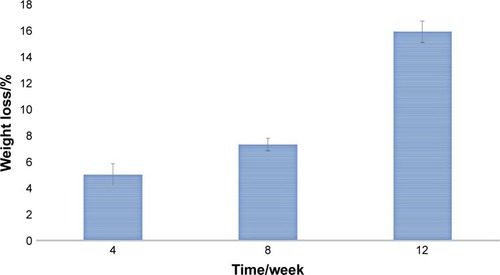
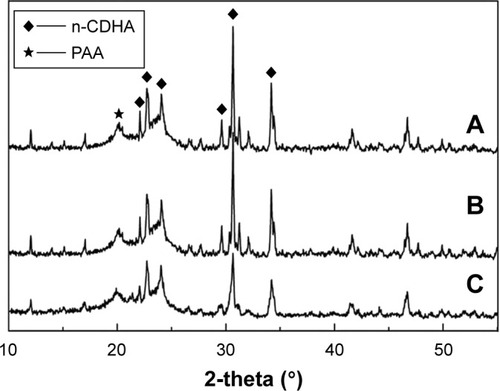
Figure 10 The result of XRD of n-CDHA/PAA screw.
Notes: (A) The outer surface of n-CDHA/PAA before implantation; (B) The internal cross-section of n-CDHA/PAA after implantation; (C) The outer surface of n-CDHA/PAA after implantation.
Abbreviations: n-CDHA/PAA, nano-calcium-deficient hydroxyapatite/poly-amino acid; XRD, X-ray diffraction.