Figures & data
Figure 1 (A) Scheme showing the fabrication process of NGO-SS-HA-Gef, its capability to target cancer cells, and intracellular drug release triggered by redox responsiveness to GSH. (B) Images of NGO and NGO-SS-HA in water, PBS, and cell medium for 1 week. FTIR spectra (C) of HA, HA-SS, NGO, and NGO-SS-HA; AFM images (D) of NGO and NGO-SS-HA. (E and G) The thickness of NGO and NGO-SS-HA measured by AFM. (F and H) Histograms of NGO and NGO-SS-HA diameters, respectively.
Abbreviations: NGO, nano-graphene oxide; HA, hyaluronic acid; Gef, gefitinib; GSH, glutathione; FTIR, Fourier transform infrared; AFM, atomic force microscopy.
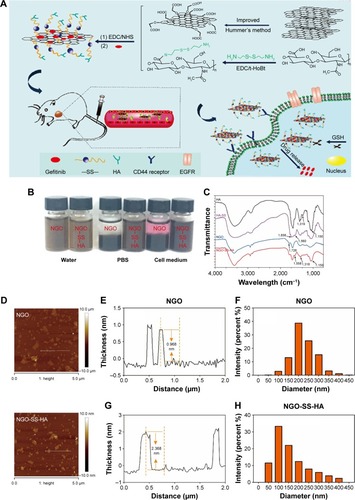
Figure 2 (A) UV–vis spectra of NGO-SS-HA-Gef obtained at different drug loading concentrations after the removal of free Gef. (B) Plots of the ratio of Gef loaded onto NGO-SS-HA at various concentrations of Gef. (C, D) Gef release from NGO-SS-HA-Gef at pH 5.5 and 7.4 in the presence of GSH as a function of time.
Abbreviations: NGO, nano-graphene oxide; HA, hyaluronic acid; Gef, gefitinib; GSH, glutathione.
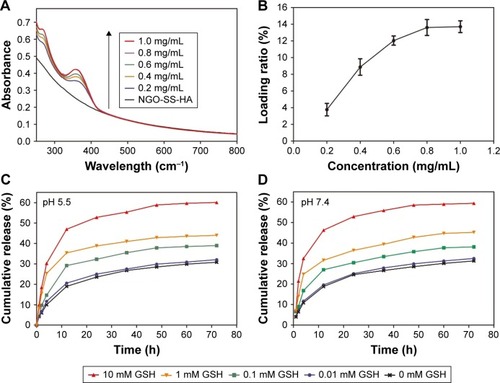
Figure 3 Cell viability of (A) A549 cells and (B) HELF cells incubated with various concentrations of NGO-SS-HA from 24 to 72 hours. (C) Hemolysis percentage of RBCs incubated with NGO-SS-HA at various concentrations for 2 hours. Inset: image of direct observation of hemolysis by NGO-SS-HA.
Abbreviations: NGO, nano-graphene oxide; HA, hyaluronic acid; Gef, gefitinib; h, hours.
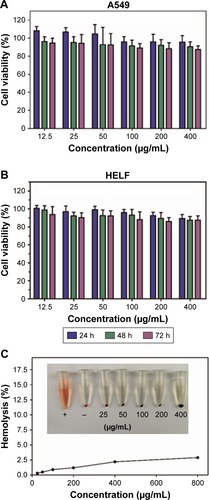
Figure 4 Confocal images (A) and flow cytometric analysis (B and C) of A549 and HELF cells with or without pre-treatment with excess HA incubated with NGO-SS-HA-RB for 2 hours. Confocal images (D) and flow cytometric measurement (E) of RB release from in A549 cells pre-treated with various concentrations of GSH-OEt; UV–vis spectra (F) of intracellular Gef concentration after A549 cells were treated with various treatments.
Abbreviations: NGO, nano-graphene oxide; HA, hyaluronic acid; Gef, gefitinib; RB, rhodamine B; GSH-OEt, glutathione reduced ethyl ester.
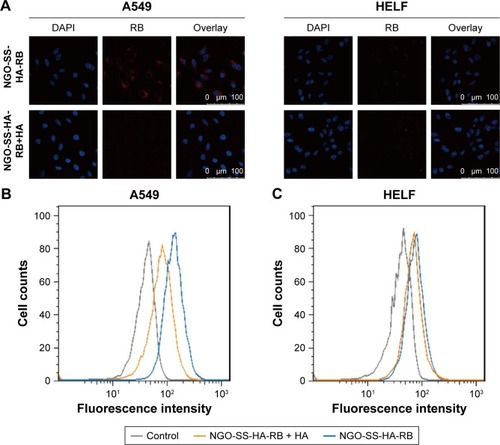
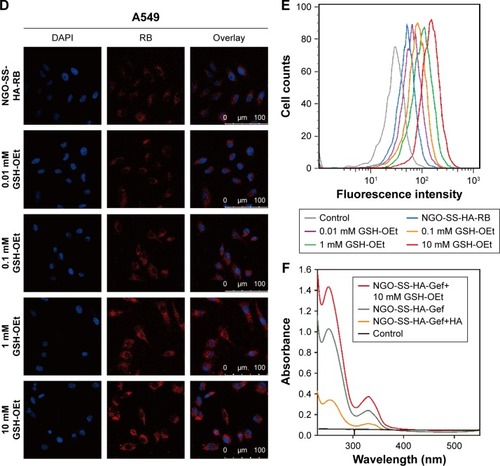
Figure 5 Cell viability of A549 cells after incubation with free Gef, NGO-SS-HA-Gef, or NGO-SS-HA-Gef +10 mM GSH-OEt for 24 (A), 48 (B), and 72 hours (C). *P<0.05, **P<0.01 (NGO-SS-HA-Gef + GSH-OEt vs free Gef and NGO-SS-HA-Gef only). The differences between groups were considered statistically significant when the P-value was <0.05.
Abbreviations: NGO, nano-graphene oxide; HA, hyaluronic acid; Gef, gefitinib; RB, rhodamine B; GSH-OEt, glutathione reduced ethyl ester.
Figure 6 (A–C) Cell cycle distribution (G0/G1, S, and G2/M) was determined after various treatments by flow cytometry. A549 cells were treated with free Gef or NGO-SS-HA-Gef ([Gef] =10 µg/mL) in the presence or absence of GSH-OEt. Controls remained untreated. (D–F) Apoptotic cells were detected by staining with FITC-Annexin V/PI after various treatments. Controls remained untreated. *P<0.05, **P<0.01 compared with the Gef group. #P<0.05 compared with the NGO-SS-HA-Gef only group.
Abbreviations: NGO, nano-graphene oxide; HA, hyaluronic acid; Gef, gefitinib; RB, rhodamine B; GSH-OEt, glutathione reduced ethyl ester; FITC, fluorescein isothiocyanate; PI, propidium iodide.
![Figure 6 (A–C) Cell cycle distribution (G0/G1, S, and G2/M) was determined after various treatments by flow cytometry. A549 cells were treated with free Gef or NGO-SS-HA-Gef ([Gef] =10 µg/mL) in the presence or absence of GSH-OEt. Controls remained untreated. (D–F) Apoptotic cells were detected by staining with FITC-Annexin V/PI after various treatments. Controls remained untreated. *P<0.05, **P<0.01 compared with the Gef group. #P<0.05 compared with the NGO-SS-HA-Gef only group.Abbreviations: NGO, nano-graphene oxide; HA, hyaluronic acid; Gef, gefitinib; RB, rhodamine B; GSH-OEt, glutathione reduced ethyl ester; FITC, fluorescein isothiocyanate; PI, propidium iodide.](/cms/asset/0b6a0304-7e28-44c3-ba31-ac59969e9585/dijn_a_12194206_f0006_c.jpg)
Figure 7 Tissue biodistribution of Gef after intravenous administration of NGO-SS-HA-Gef to A549 tumor-bearing mice: (A) 1, (B) 2 and (C) 12 hours following administration, with free Gef used as a control. Error bars were based on three parallel mice. Significant differences between groups are labeled with *P<0.05 and **P<0.01.
Abbreviations: NGO, nano-graphene oxide; HA, hyaluronic acid; Gef, gefitinib.
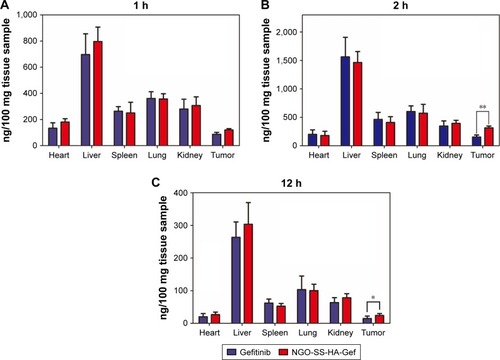
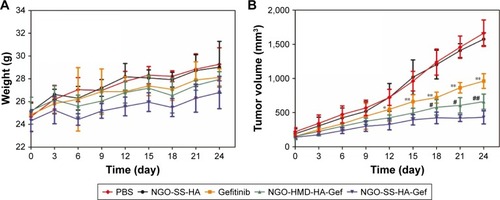
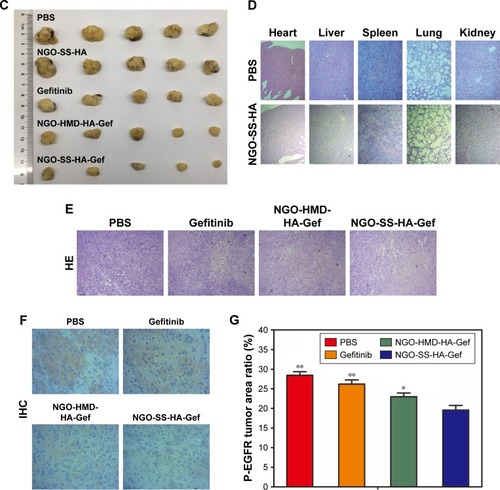
Figure 8 Comparative investigation of tumor inhibitory effects in vivo.
Notes: (A) Relative mouse body weight of each group as a function of time. (B) Tumor growth curves of different groups of mice after various treatments. Significant differences appeared between the NGO-SS-HA-Gef and the free Gef groups and are marked as *P<0.05 and **P<0.01. Significant differences appeared between the NGO-SS-HA-Gef and NGO-HMD-HA-Gef groups and are labeled with #P<0.05 and ##P<0.01. (C) Photographs of tumors from the five groups. (D) H&E images of major organs from control mice and mice 24 days post-NGO-SS-HA injection. (D and E) H&E staining of tumors from different groups. (F) IHC analysis of the expression of P-EGFR in mice; P-EGFR was stained brown. (G) Quantification of the P-EGFR expression in mice after various treatments. *P<0.05 and **P<0.01 compared with the NGO-SS-HA-Gef group.
Abbreviations: NGO, nano-graphene oxide; HA, hyaluronic acid; Gef, gefitinib; HMD, hexamethylenediamine; RB, rhodamine B; GSH-OEt, glutathione reduced ethyl ester; P-EGFR, phosphorylation of epidermal growth factor receptor tyrosine; H&E, hematoxylin and eosin; IHC, immunohistochemical.