Figures & data
Figure 1 Cumulative release.
Note: Cumulative release profile of insulin from insulin/chitosan.
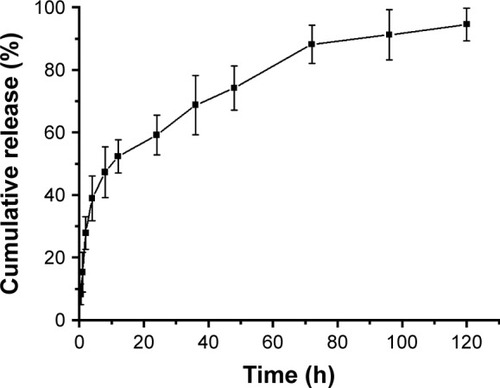
Figure 2 Blood glucose levels.
Notes: Blood concentration of control, free insulin, insulin/chitosan (subcutaneous injection), and insulin/chitosan (oral administration). The blood glucose levels in the control, free insulin, and insulin/chitosan groups were collected, and results are expressed as mean ± SD. The results showed that diabetic rats injected with insulin maintained blood glucose contents in normal change for about 30 min, after which glycemia slowly raised compared to the control group; diabetic rats injected with insulin/chitosan (subcutaneous injection) maintained blood glucose contents in normal change for about 6 h, after which glycemia slowly raised compared to the insulin group. By contrast, insulin/chitosan (oral administration) lessened blood glucose contents to 6.3 mmol/L at 2 h after administration. Over the following 120 h, blood glucose content augmented to 5.1 mmol/L and was then maintained at ~4.3–6.3 mmol/L for 120 h compared to insulin/chitosan (subcutaneous injection) group.
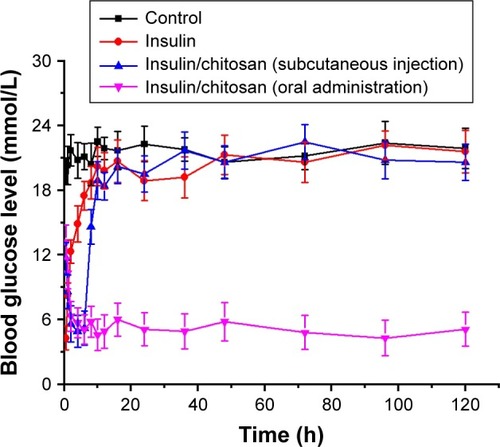
Figure 3 Histopathological evaluation.
Notes: Histopathological evaluation of mesentery injury and quantitative injury scores. Control group; light microscopy images (×400). The histopathological evaluation in the control, insulin, insulin/chitosan (subcutaneous injection), and insulin/chitosan (oral administration) groups were collected, and results are expressed as mean ± SD. A significant decrease from the control group is denoted by *P<0.01 and **P<0.01.
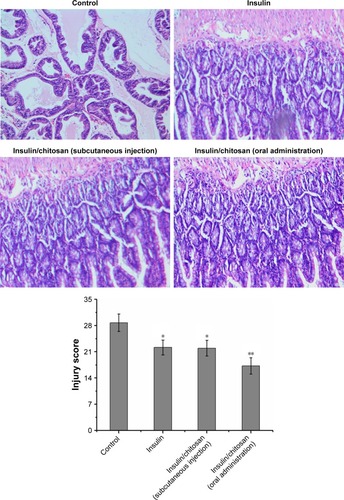
Figure 4 Microcirculation change.
Notes: The microcirculation change in the control, insulin, insulin/chitosan (subcutaneous injection), and insulin/chitosan (oral administration) groups were collected, and results are expressed as mean ± SD. Arteriole velocity: a significant increase from the control group is denoted by *P<0.01 and a significant increase from the control group is denoted by **P<0.01; arteriole diameter: a significant increase from the control group is denoted by *P<0.01 and a significant increase from the control group is denoted by **P<0.01; venular diameter: a significant increase from the control group is denoted by *P<0.01 and a significant increase from the control group is denoted by **P<0.01; and hemodiapedesis: a significant decrease from the control group is denoted by *P<0.01 and **P<0.01. Arteriole velocity (V/µm/g), arteriole diameter (L/µm), venular diameter (L/µm), and hemodiapedesis (visual).
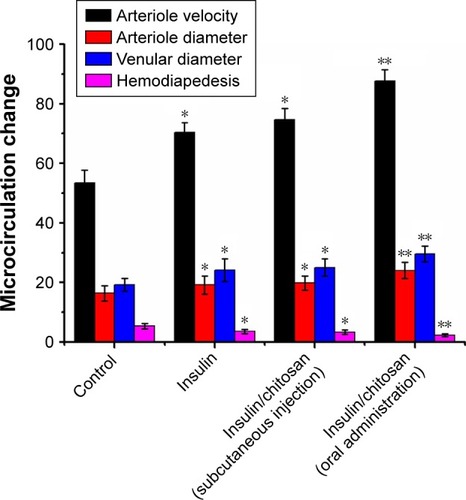
Figure 5 Expression of COX-2 and VCAM-1.
Notes: The expression of COX-2 and VCAM-1 in the control, insulin, insulin/chitosan (subcutaneous injection), and insulin/chitosan (oral administration) groups were collected, and results are expressed as mean ± SD. COX-2: a significant decrease from the control group is denoted by *P<0.01 and **P<0.01; VCAM-1: a significant decrease from the control group is denoted by *P<0.01 and **P<0.01.
Abbreviations: COX-2, cyclooxygenase-2; VCAM-1, vascular cell adhesion molecule.
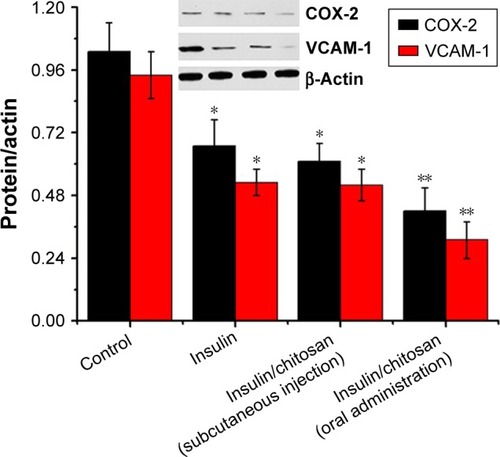
Figure S1 Citosan.
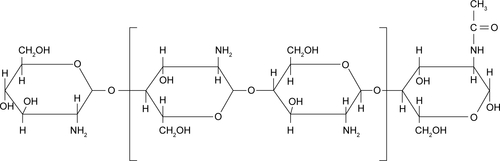
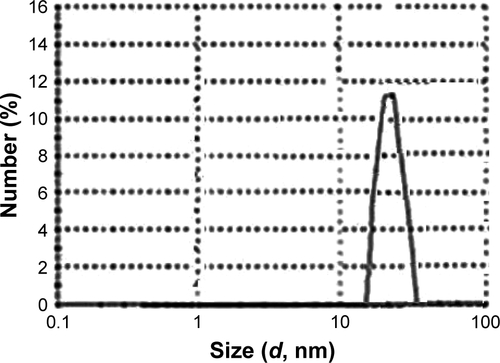
Figure S2 The TEM image of insulin/chitosan.
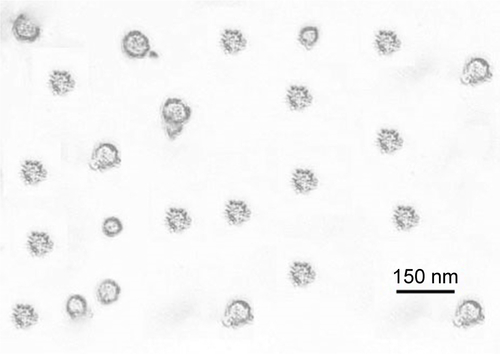
Figure S3 The particle size of insulin/chitosan.