
Figures & data
Figure 1 Z-average hydrodynamic size of 10, 50, and 100 nm silver nanoparticles diluted with water and DMEM cell-cultured media (24 hours).
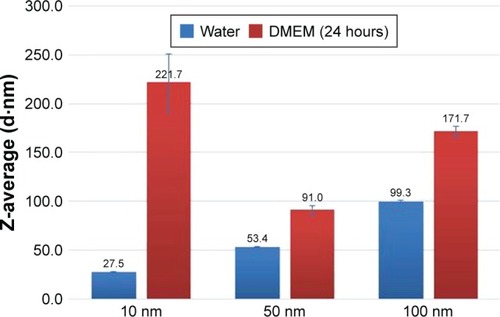
Figure 2 Representative TEM images of 10, 50, and 100 nm Ag nps diluted with water and DMEM cell-cultured media (24 hours).
Abbreviations: Ag nps, silver nanoparticles; TEM, transmission electron microscopy.
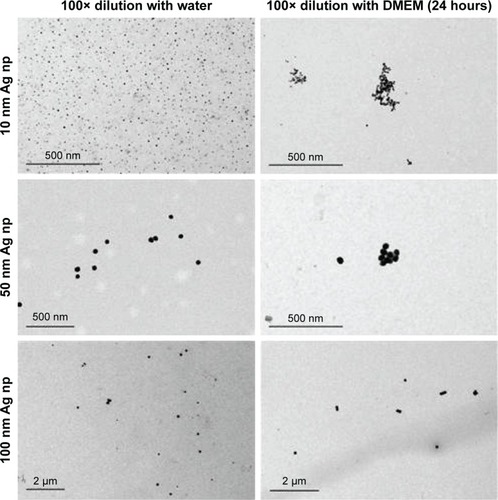
Figure 3 Flow cytometric detection of Ag np within RAW264.7 macrophage demonstrating increases in SSC with Ag np of increasing size.
Notes: (A) Representative histograms showing changes in SSC as associated with the size of the Ag np phagocytized by RAW264.7, and associated with 774 nm wavelength emissions. (B) Cellular SSC increases are associated with the size of phagocytized Ag np. (C) Cells were incubated with Ag np for variable lengths of time and assayed for red fluorescence (n=2). (D) Dose-dependent emissions, as represented by the median fluorescence values, were obtained with Ag np. Ten-fold dilutions of each size Ag np were added to each cell sample and incubated for analysis. (E) Ag np was diluted in either culture media or 2% milk, and added to each culture. Detectable emissions from the Ag np were detected in the infrared region, ie, PE-Cy7. The averaged (n=3) median fluorescence values are shown.
Abbreviations: Ag nps, silver nanoparticles; FSC, forward scatter; SSC, side scatter; Trt, Treated; APC, Allophycocyanin.
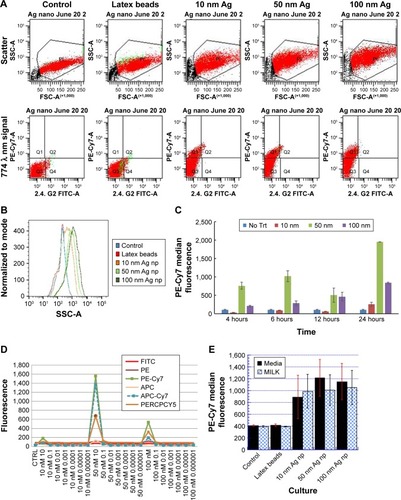
Table 1 The averaged PE-Cy7 median fluorescence values (PE-Cy7 MFV) were obtained in six individual experiments and are represented in this table
Table 2 ANOVA
Figure 4 Ingestion of Ag np is associated with an increased expression of F4/80.
Note: Percentages of F4/80+ cells were calculated as a percent of total cells within the gate, which excluded dead cells and debris.
Abbreviation: Ag nps, silver nanoparticles.
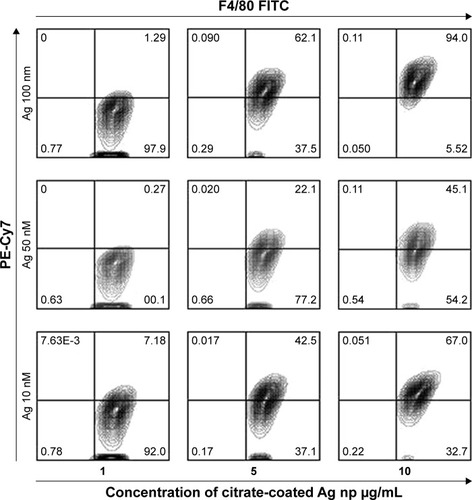
Figure 5 RAW264.7 demonstrates alterations in anti-CD283 monoclonal fluorescence following incubation with Ag np.
Notes: Gates were set to separate live cells from dead. (A) Surface staining for TLR3. The cultured cells were collected, spun, washed, blocked with unlabeled 2.4. G2 monoclonal (Pharmingen, Becton-Dickinson), and stained for TLR3 using FITC-conjugated MCA5891F (Serotec). Percentages were derived within the gating for CD283 expression (green fluorescence). Data are representative of three experiments, showing the average percentages of CD283+ cells. *Significant differences compared with bead control (*P<0.05). (B) Intracytoplasmic staining for TLR-3. RAW cells incubated with Ag np as described were fixed, permeabilized, and stained for TLR3 using FITC-conjugated anti-CD283 (MCA5891F, Serotec). The mean values are represented from the acquired data of three independent experiments with standard error. (C) Histograms depicting SSC and TLR-3-associated fluorescence in cultures containing 10 nm Ag np at a concentration of 10 µg/mL. The results show histograms obtained with surface and cytoplasmic staining.
Abbreviations: Ag nps, silver nanoparticles; FSC, forward scatter; SSC, side scatter; TLR, Toll-like receptor.
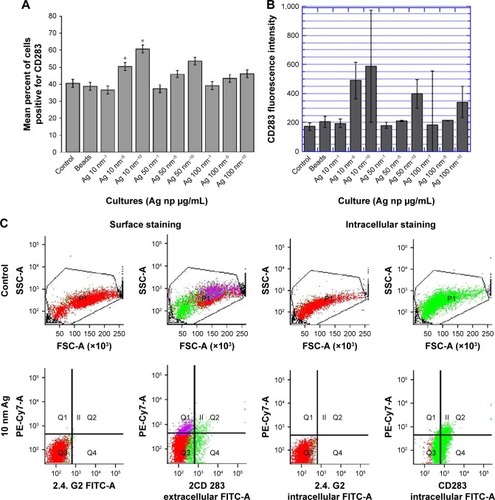
Figure 6 Flow cytometric analysis of CD284 (Toll-like receptor 4) expression in RAW cells cultured with Ag np.
Note: The data represent the red fluorescence associated with Ag np ingestion vs the fluorescence associated with the anti-CD284 monoclonal.
Abbreviation: Ag nps, silver nanoparticles.
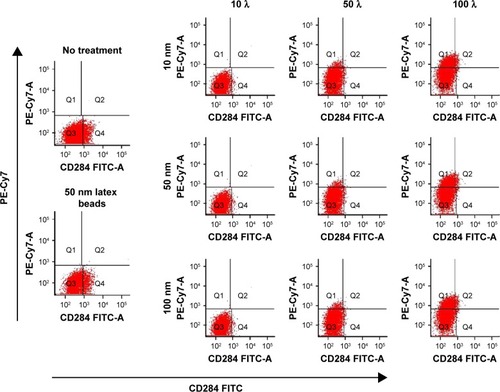
Figure S1 DLS distribution graphs of 10 nm, 50 nm and 100 nm Ag NPs diluted with water and DMEM cell cultured media (24 hours).
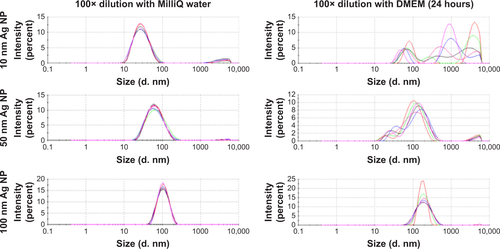
Table S1 ICP-MS analysis of supernatants of 10 nm, 50 nm and 100 nm Ag NPs diluted to 10 µg/mL in water and DMEM cell cultured media (24 hours) showing the concentration of Ag ions increased upon incubation with DMEM cell media except that for 10 nm. The higher concentration of Ag ions was detected in the water supernatant because the centrifugal force used, 25,500 g, was not high enough to completely precipitate 10 nm Ag NPs