Figures & data
Figure 1 A drug delivery platform based on functionalized layer-by-layer nanoparticles incorporated by hBMSCs with homing properties to target the injured vessel.
Abbreviation: PS, poly (lactide-co-glycolide)-stearylamine.
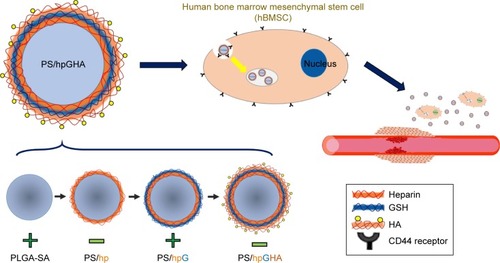
Figure 2 Physicochemical characterization of PS/hpGHA NPs.
Notes: Effects of additional layers on (A) zeta potential and (B) hydrodynamic size. (C) Core shell structures of PLGA-SA and PS/hpGHA NPs under transmission electron microscope. (D) Stability of PLGA-SA and PS/hpGHA NPs in PBS (pH 7.4) during 96 hours of incubation.
Abbreviations: NPs, nanoparticles; PLGA, poly (lactide-co-glycolide); PS, poly (lactide-co-glycolide)-stearylamine; SA, stearylamine.
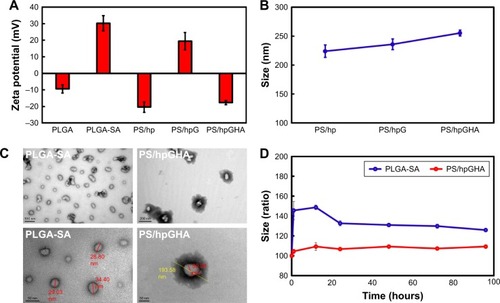
Figure 3 (A) Release profiles of heparin from PS/hpGHA NPs over 96 hours at 37°C in PBS. (B) Blood coagulation assays of PLGA-SA and PS/hpGHA NPs (heparin =0.4 and 0.6 IU) relative to heparin (0.4 and 0.6 IU) (**P<0.01 and ***P<0.001).
Abbreviations: NPs, nanoparticles; PLGA, poly (lactide-co-glycolide); PS, poly (lactide-co-glycolide)-stearylamine; SA, stearylamine.
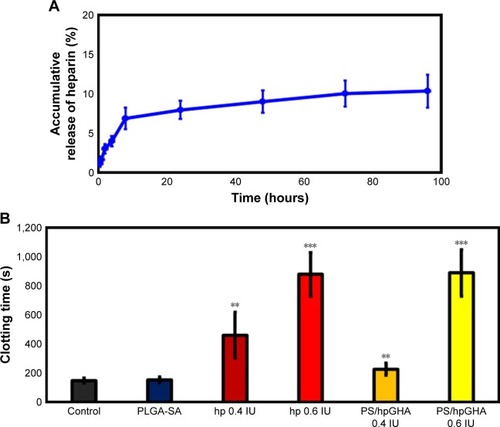
Figure 4 Evaluation of SHO systems.
Notes: (A) Fluorescence images of 1% SF and 10 IU HRP mixture after addition of H2O2 at 0, 0.40, 0.81, 1.62, 2.43, and 3.24 mM at 37°C for 1 hour. (B) Quantity of fluorescence intensity from SF transparent gel in (A). (C) Comparison of antioxidant abilities of various groups in 1% SF and 10 IU HRP solutions: SF + HRP, SF + HRP + H2O2, SF + HRP + H2O2 + GSH, SF + HRP + H2O2 + PLGA-SA, and SF + HRP + H2O2 + PS/hpGHA. (D) Fluorescence intensity of SF transparent gel that was treated with GSH (0.03, 0.08, 0.16, 0.33, and 0.65 mM), PS/hpGHA (GSH =0.06 mM), and PLGA-SA (*P<0.05).
Abbreviations: GSH, glutathione; HRP, horse peroxidase; PLGA, poly (lactide-co-glycolide); PS, poly (lactide-co-glycolide)-stearylamine; SA, stearylamine; SF, silk fibroin; SHO, SF/HRP/Optical.
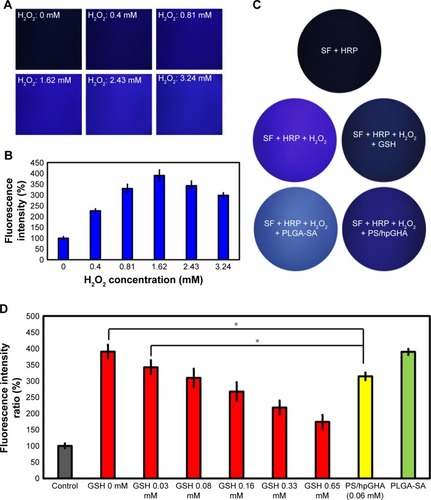
Figure 5 Antioxidant properties of PS/hpGHA NPs in vitro.
Notes: (A) Cell viability of L929 cells treated with PS/hpGHA NPs (0, 10, 50, 100, and 200 µg/mL) for 24 hours. (B) Protection of PS/hpGHA NPs from H2O2-mediated toxicity. Cell viabilities were measured for L929 cells incubated for 24 hours with H2O2, H2O2 + PLGA-SA, and H2O2 + PS/hpGHA NPs. (C) Cytotoxicity of LPS on L929 cells. Viabilities of L929 cells that were incubated for 24 hours with PBS, PS/hpGHA NPs, LPS, and LPS + PS/hpGHA NPs were measured.
Abbreviations: LPS, lipopolysaccharide; NPs, nanoparticles; PLGA, poly (lactide-co-glycolide); PS, poly (lactide-co-glycolide)-stearylamine; SA, stearylamine.
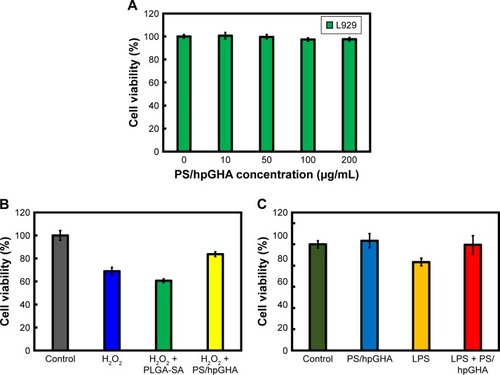
Figure 6 H2O2 treatment causes superoxide generation in HUVECs.
Notes: MitoSOX levels were evaluated in HUVECs using MitoSOX Red. HUVECs were treated with PBS (control), H2O2, H2O2 + PLGA-SA, and H2O2 + PS/hpGHA NP for 2 hours (blue = DAPI, red = MitoSOX).
Abbreviations: HUVEC, human umbilical vein endothelial cell; MitoSOX, mitochondrial superoxide; NP, nanoparticle; PLGA, poly (lactide-co-glycolide); PS, poly (lactide-co-glycolide)-stearylamine; SA, stearylamine.
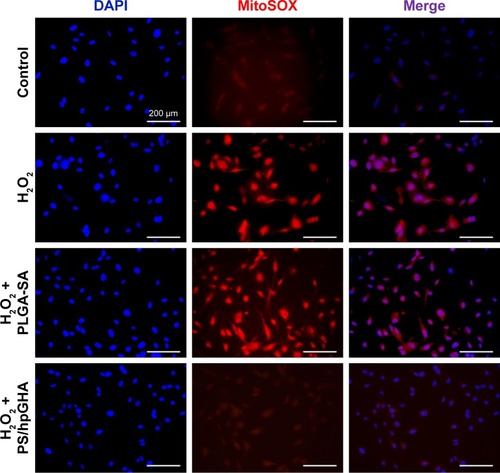
Figure 7 H2O2-induced hypoxia in HUVECs.
Note: Cells were treated with PBS (control), H2O2, H2O2 + PLGA-SA, and H2O2 + PS/hpGHA NP for 2 hours and then processed for immunostaining analysis (blue = DAPI, red = ACTIN, green = HIF-1α).
Abbreviations: HUVEC, human umbilical vein endothelial cell; NP, nanoparticle; PLGA, poly (lactide-co-glycolide); PS, poly (lactide-co-glycolide)-stearylamine; SA, stearylamine.
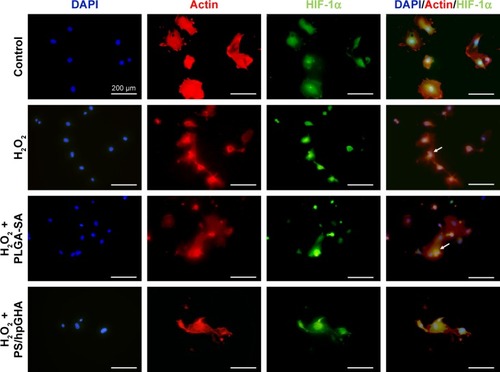
Figure 8 In vitro study of hBMSCs treated with PS/hpGHA NPs.
Notes: (A) Cell viability of hBMSCs treated with PS/hpGHA NPs at concentrations of 10, 50, 100, and 200 µg/mL after 24 hours. (B) Confocal images of PLGA-SA or PS/hpGHA NPs in hBMSCs at 15, 30, 60, and 120 minutes confirmed cellular uptake (blue = DAPI, green = FITC-labeled PLGA-SA or PS/hpGHA NPs). (C) Fluorescence intensity was quantified by analyzing images in (B) (*P<0.05, **P<0.01).
Abbreviations: hBMSC, human bone marrow mesenchymal stem cells; NP, nanoparticle; PLGA, poly (lactide-co-glycolide); PS, poly (lactide-co-glycolide)-stearylamine; SA, stearylamine.
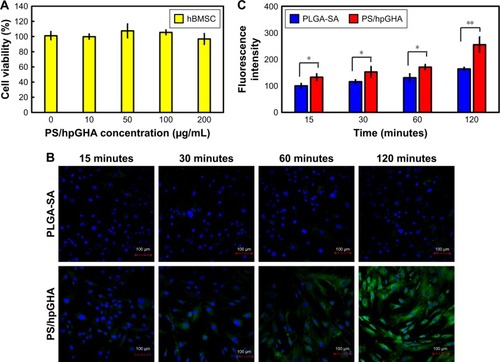
Figure 9 Targeting effectiveness of PS/hpGHA NPs.
Notes: (A) hBMSCs were pretreated with HA for 1 hour to block CD44 receptor, and then cells were treated with PS/hpGHA NPs for 2 hours. The confocal image presents cellular uptake of PS/hpGHA NPs (blue = DAPI, green = FITC-labeled PLGA-SA or PS/hpGHA NPs, red = actin). (B) Fluorescence intensity obtained from images (A).
Abbreviations: hBMSC, human bone marrow mesenchymal stem cells; NP, nanoparticle; PLGA, poly (lactide-co-glycolide); PS, poly (lactide-co-glycolide)-stearylamine; SA, stearylamine.
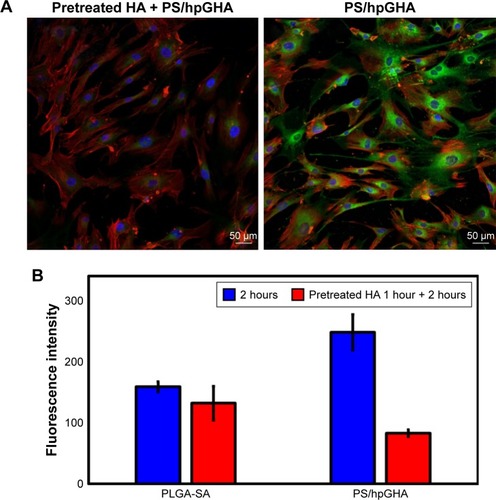
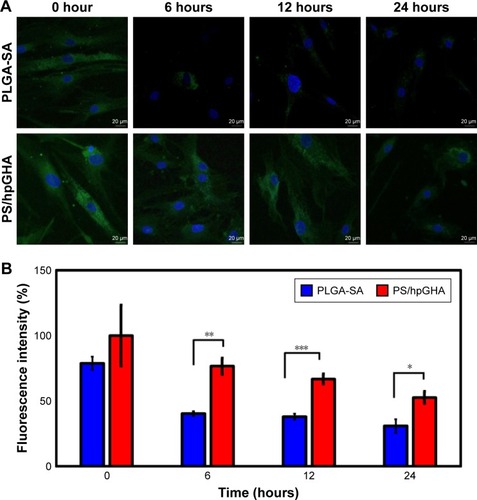
Figure 10 Retention time of NPs in hBMSCs.
Notes: (A) hBMSCs were treated with PLGA-SA and PS/hpGHA NPs that were labeled with FITC for 6 hours, and then washed out. Fluorescence images show NPs in hBMSCs after treatment for 0, 6, 12, and 24 hours (blue = DAPI, green = PLGA-SA or PS/hpGHA NPs) (scale bar =20 µm). (B) Retentions of PLGA-SA and PS/hpGHA NPs obtained from fluorescence intensity (*P<0.05, **P<0.01, ***P<0.001).
Abbreviations: hBMSC, human bone marrow mesenchymal stem cells; NP, nanoparticle; PLGA, poly (lactide-co-glycolide); PS, poly (lactide-co-glycolide)-stearylamine; SA, stearylamine.