Figures & data
Figure 1 Size distribution and morphology of amphotericin B-polybutylcyanoacrylate nanoparticles (AmB-PBCA-NPs). A) The mean diameter of polysorbate 80-coated AmB-PBCA-NPs determined by a Coulter Laser Granulometer was 69.0 ± 28.6 nm. B) AmB-PBCA-NPs without polysorbate 80 coating were spherical in shape. C) AmB-PBCA-NPs after polysorbate 80 modification had a more elliptical shape but were of a similar size to uncoated particles (×50,000).
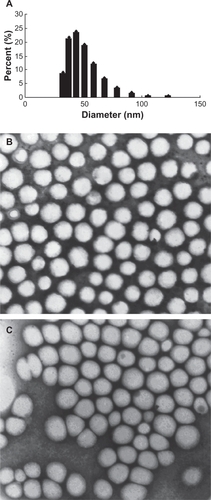
Figure 2 Amphotericin B (AmB) levels in various tissues following injections of AmB, amphotericin B-polybutylcyanoacrylate nanoparticles (AmB-PBCA-NPs), or amphotericin B liposome (AmB-L). A) High-performance liquid chromatogram showing the presence of AmB in brain tissue. The detection limit of AmB was 10 ng/mL, and the interday and intraday coefficients of variation were 5% or less between 5 ng/mL and 200 ng/mL. B) AmB was not detected in the brain tissue of mice treated with noncomplexed AmB but was found 30 minutes after AmB-PBCA-NP treatment and 3–6 hours after AmB-L treatment (n = 28/group). C–D) The concentration of AmB in various tissues is shown after AmB, AmB-L, and AmB-PBCA-NP treatment, respectively (n = 28). AmB was concentrated mainly in the liver; note also the higher lung concentration when using AmB-PBCA-NPs.
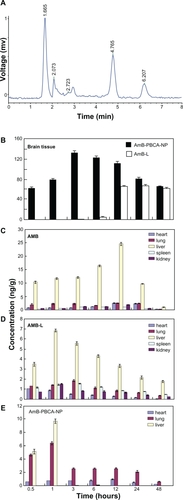
Figure 3 Survival rate of mice under different treatments. All amphotericin B (AmB)-treated mice died within 15 days. In contrast, 80% of the mice survived after amphotericin B-polybutylcyanoacrylate nanoparticle (AmB-PBCA-NP) injections, and 60% survived after amphotericin B liposome (AmB-L) treatment (n = 20/group).
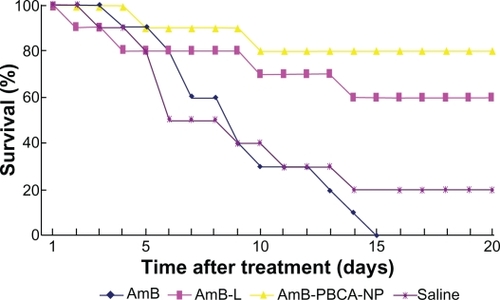
Figure 4 Fungal load in the brain of Balb/c mice infected with Cryptococcus neoformans treated with amphotericin B (AmB), amphotericin B liposome (AmB-L), amphotericin B-polybutylcyanoacrylate nanoparticles (AmB-PBCA-NPs), or saline.
Notes: Data were assessed from plated brain tissue and the number of colony-forming units (CFU). *P < 0.05, value vs AmB group; b*P < 0.05, value vs AmB-L group (n = 10/group).
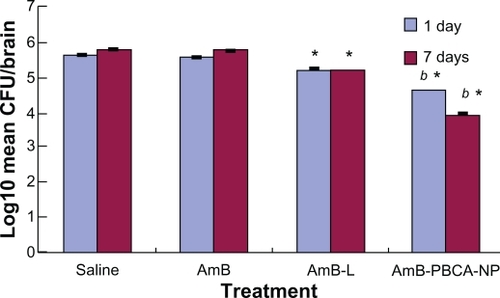
Figure 5 Whole-blood analysis after treatment. Mice were injected daily via the tail vein with i) amphotericin B (AmB) (1 mg/kg), ii) polysorbate 80-coated amphotericin B-polybutylcyanoacrylate nanoparticles (AmB-PBCA-NPs) (3 mg/kg), iii) blank-PBCA-NPs (3 mg/kg), and iv) polysorbate 80 (1%). Indices: A) White blood cell count (WBC) (× 109/L); B) Red blood cell count (RBC) (×1012/L); C) hemoglobin (Hb) (g/L); D) platelet count (PLT) (×109/L).
Notes: **P < 0.01; *P < 0.05, value vs −1 day; b**P < 0.01, value vs that at 1 day; c**P < 0.01, AmB value vs Amb-PCNB-NP value on the same day; c*P < 0.05, AmB value vs Amb-PCNB-NP value on the same day. Values are given as the mean ± standard deviation (n = 10/group).
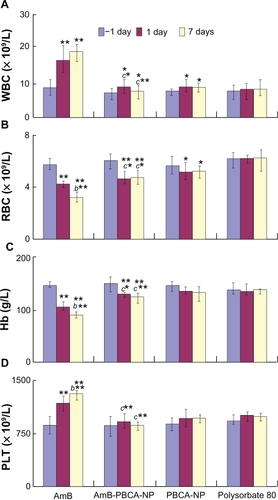
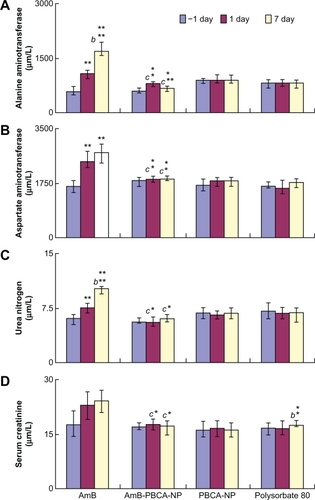
Figure 6 Tests for liver and kidney function. A) Serum levels of alanine aminotransferase and B) aspartate aminotransferase as an indicator of liver function. C) Serum levels of blood urea nitrogen and D) serum creatinine as an indicator of kidney function.
Notes: **P < 0.01; *P < 0.05, value vs −1 day; b**P < 0.01, value vs that at 1 day; c**P < 0.01, amphotericin B (AmB) value vs amphotericin B-polybutylcyanoacrylate nanoparticle (Amb-PCNB-NP) value on the same day; c*P < 0.05, AmB value vs Amb-PCNB-NP value on the same day. Values are given as the mean ± standard deviation (n = 10/group).