Figures & data
Table 1 Composition of D formulations, expressed as % w/w
Table 2 Full factorial design experimental points
Figure 1 Factor space and experimenting points of a full factorial design.
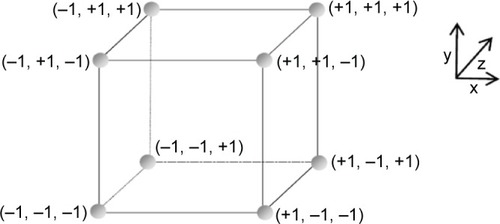
Figure 2 ΔG′ values calculated for DEX 30% w/w/ALG mixtures containing increasing ALG concentrations (0.5%, 1%, and 1.5% w/w) (mean values ± SD; n=3). Abbreviations: DEX, dextran; ALG, alginate.
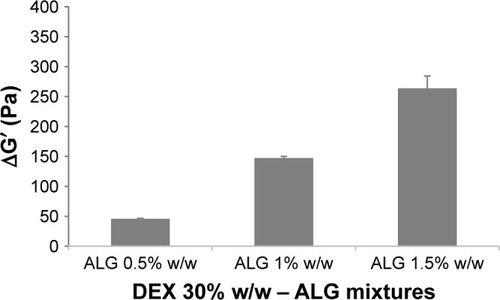
Table 3 Mean values (±SD; n=3) of viscosity at 1,000 s−1, pseudoplasticity index, surface tension, and conductivity of each ALG/DEX formulation
Figure 3 SEM micrographs of (A) D1, (B) D2, (C) D3, (D) D4, (E) D5, (F) D6; (G) D7, and (H) D8 products obtained from electrospinning.
Abbreviations: ALG, alginate; D, ALG/DEX-based solutions; DEX, dextran; SEM, scanning electron microscopy.
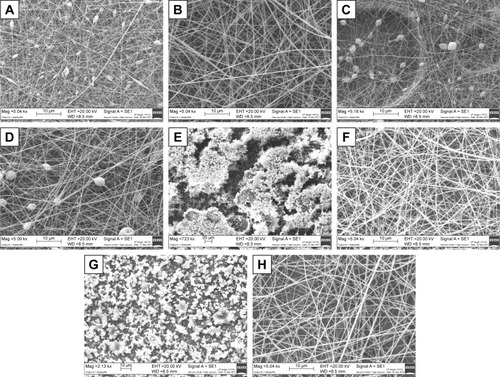
Figure 4 Standardized Pareto chart (A and C) and interaction plot (B and D) of the response variable fiber formation of the full factorial design.
Notes: Three factors, viscosity at high shear rates, surface tension, and conductivity were investigated in A and B, while pseudoplasticity index, surface tension, and conductivity were investigated in C and D.
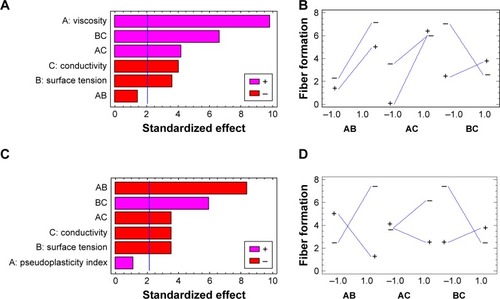
Table 4 Composition (% w/w) and properties (mean values ± SD; n=3) of the polymer solutions D9–D12 prepared to verify the predictive power of the DoE approach
Figure 5 SEM micrographs of (A) D9, (B) D10, (C) D11, and (D) D12 products obtained from electrospinning.
Abbreviations: ALG, alginate; D, ALG/DEX-based solutions; DEX, dextran; SEM, scanning electron microscopy.
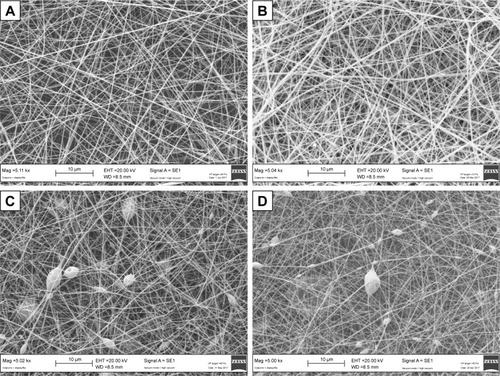
Figure 6 SEM micrograph of the optimized ALG/PEO fibers (P1).
Abbreviations: ALG, alginate; PEO, polyethylene oxide; SEM, scanning electron microscopy.
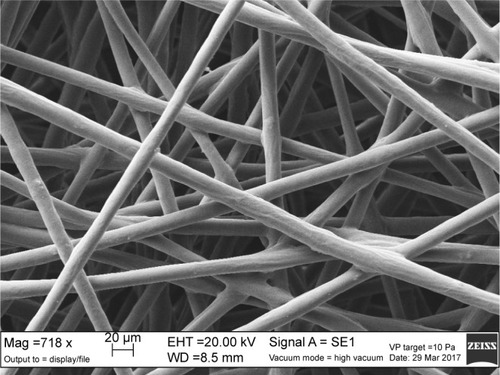
Figure 7 Mechanical properties of both D9 and P1 fibers: maximum force of deformation (Fmax) and forces (F) measured at different deformation values are reported (mean values ± SE; n=3). *P<0.05 Student’s t-test.
Abbreviations: ALG, alginate; D, ALG/DEX-based solutions; P, ALG/PEO fibers; PEO, polyethylene oxide.
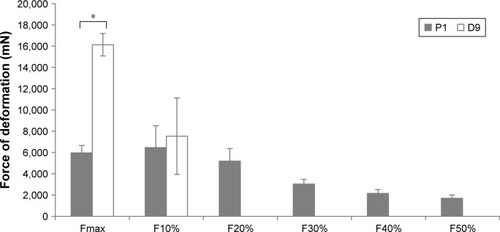
Figure 8 Characterization of D9 fibers after PLGA-based coating: (A) SEM micrographs; (B) fiber dimensions (mean values ± SD; n=30), one-way ANOVA, multiple range test (P<0.05): a vs b and c; (C) FTIR spectrographs.
Abbreviations: ALG, alginate; D, ALG/DEX-based solutions; DEX, dextran; FTIR, Fourier transform infrared; PLGA, polylactide-co-glycolide.
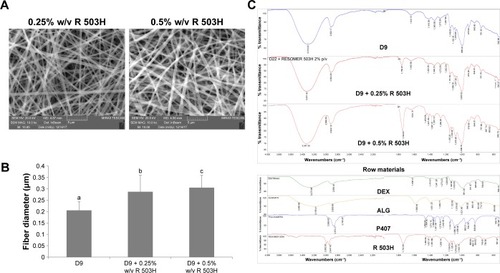
Figure 9 Mechanical properties of D9 as such and after coating with R 503H at 0.25% and 0.5% w/v: (A) maximum force of deformation (Fmax) and forces (F) measured at different deformation values (*P<0.05 compared to D9 Fmax and #P<0.05 compared to D9 F10%, Student’s t-test), (B) tensile work (*P<0.05 compared to D9, Student’s t-test), and (C) percentage of fiber elongation (*P<0.05 compared to D9) are reported (mean values ± SE; n=3).
Abbreviations: ALG, alginate; D, ALG/DEX-based solutions; DEX, dextran.
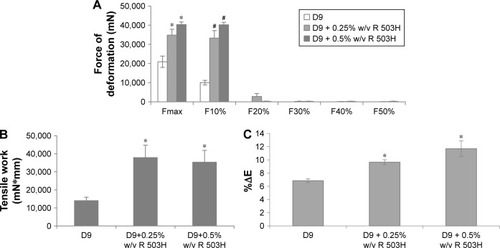
Table 5 Element content (mol %) of coated P1 fibers before and after hydration in deionized water
Figure 10 Characterization of P1 fibers after Ca2+ cross-linking and chitosan-based coating: (A) SEM micrographs; (B) fiber dimensions (mean ± SD; n=30), one-way ANOVA, multiple range test (P<0.05): a vs b and c; (C) FTIR spectrographs.
Abbreviations: ALG, alginate; D, ALG/DEX-based solutions; P, ALG/PEO fibers; PEO, polyethylene oxide; SEM, scanning electron microscopy; FTIR, Fourier transform infrared.
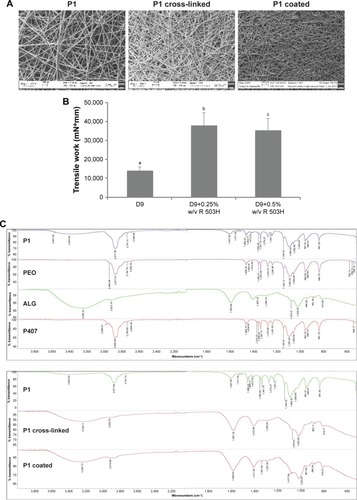
Figure 11 Mechanical properties of P1 fibers as such and after Ca2+ cross-linking and chitosan-based coating: (A) maximum force of deformation (one-way ANOVA, multiple range test [P<0.05]: a vs b and c; b vs c), (B) tensile work (one-way ANOVA, multiple range test [P<0.05]: a vs b and c; b vs c), and (C) percentage of fiber elongation are reported (mean values ± SE; n=3).
Abbreviations: ALG, alginate; P, ALG/PEO fibers; PEO, polyethylene oxide.
![Figure 11 Mechanical properties of P1 fibers as such and after Ca2+ cross-linking and chitosan-based coating: (A) maximum force of deformation (one-way ANOVA, multiple range test [P<0.05]: a vs b and c; b vs c), (B) tensile work (one-way ANOVA, multiple range test [P<0.05]: a vs b and c; b vs c), and (C) percentage of fiber elongation are reported (mean values ± SE; n=3).Abbreviations: ALG, alginate; P, ALG/PEO fibers; PEO, polyethylene oxide.](/cms/asset/2612b1b1-8cfd-431a-9682-1d0adda1cf85/dijn_a_12194227_f0011_b.jpg)
Figure 12 % Cell viability values observed for coated D9 and P1 fibers (mean values ± SD; n=6).
Abbreviations: ALG, alginate; CM, complete medium; D, ALG/DEX-based solutions; DEX, dextran; P, ALG/PEO fibers; PEO, polyethylene oxide.
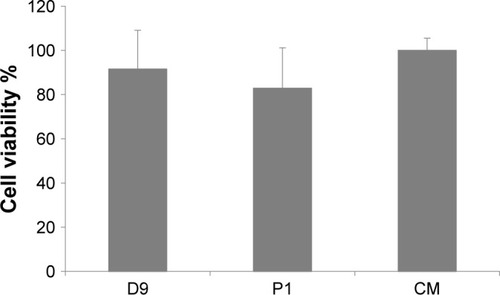
Figure 13 SEM micrographs of the coated fibers: (A, B) coated D9 fibers after immersion for 7 days in complete medium in the absence (A) and in the presence (B) of fibroblasts; (C–E) coated P1 fibers after immersion for 7 days in complete medium in the presence of fibroblasts. The yellow arrows indicate cells.
Abbreviations: ALG, alginate; D, ALG/DEX-based solutions; P, ALG/PEO fibers; PEO, polyethylene oxide; SEM, scanning electron microscopy.
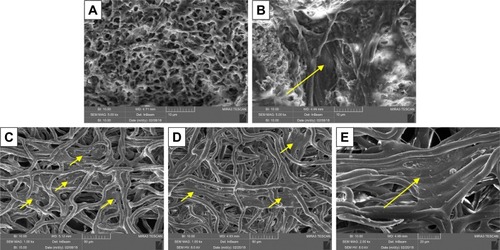
Figure S1 G′ vs frequency profiles of blends of 30% w/w DEX with different ALG concentrations and of the individual polymer solutions (mean values ± SD; n=3); (A) ALG 0.5% w/w–DEX 30% w/w, (B) ALG 1% w/w–DEX 30% w/w, (C) ALG 1.5% w/w–DEX 30% w/w.
Abbreviations: DEX, dextran; ALG, alginate.
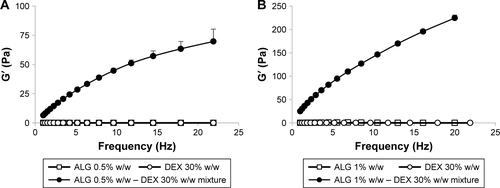
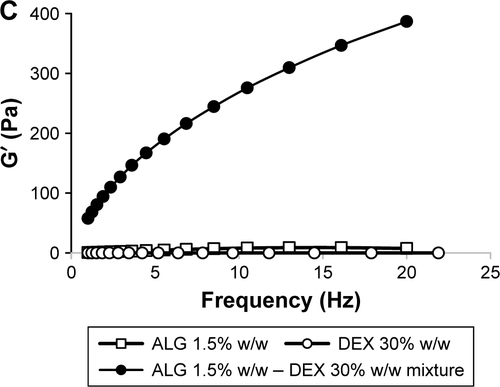
Figure S2 Viscosity parameters (η0 and η∞) as a function of dextran concentration for solutions prepared in distilled water.
Note: Log–log profiles are reported in the inset.
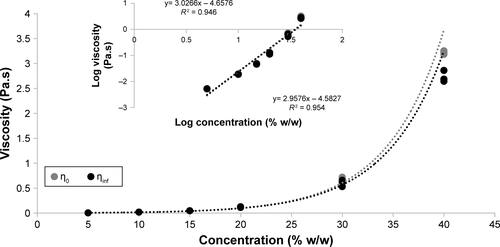
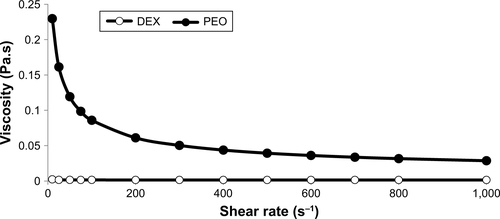
Figure S3 Comparison of viscosity profiles, observed at 33°C, of DEX and PEO solutions, both prepared in deionized water at the concentration of 1% w/w (mean values ± SD; n=3).
Abbreviations: DEX, dextran; PEO, polyethylene oxide.