Figures & data
Figure 1 UV-visible and TEM characterization.
Notes: (A) UV-visible spectra characterization. AuNR (blue line) produces a longitudinal 512 nm peak and a transverse 762 nm peak (blue arrow). After conjugation with the CLPFFD peptide, the AuNR-CLPFFD (red line) presented a shift to a longitudinal 514 nm peak and a transverse 771 nm peak (red arrow). The graphic representation shows the peak displacement, indicating the conjugation of the CLPFFD peptide to the surface of the AuNR. (B) Characterization of the shape and aspect ratio of AuNR-CLPFFD. A representative TEM image of AuNR-CLPFFD showing the cylindrical shape of the nanoparticles is presented. The inset shows the aspect ratio histogram of the observed nanoparticles. The average aspect ratio, which was 5±0.9 (length/width), was determined by measuring 150 nanoparticles in different images.
Abbreviations: TEM, transmission electron microscopy; AuNR, gold nanorod.
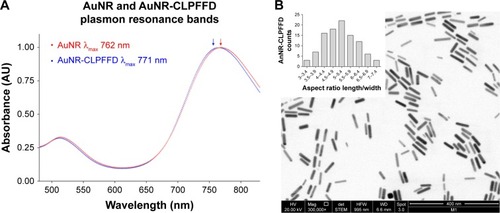
Figure 2 Hydrodynamic diameter and zeta potential characterization.
Notes: (A) Hydrodynamic diameter of AuNR-CLPFFD and the AuNR-CLPFFD/siRNA complex. The average hydrodynamic diameter of AuNR-CLPFFD was 90 nm in length and 6 nm in width with a polydispersity index (PDI) of 0.5. The hydrodynamic diameter of the AuNR-CLPFFD/siRNA complex increased to 206 nm in length and 9 nm in width with a PDI of 0.7 (column graphic), suggesting the association of multiple AuNR-CLPFFD with siRNA molecules and their molecular rearrangement. (B) Zeta potential changes from 47.8 mV in AuNR-CLPFFD (red line) to 25 mV in AuNR-CLPFFD/siRNA complex (green line) (quantified in the column graphic) were observed, suggesting that electrostatic interactions occur between positively charged AuNR-CLPFFD and negatively charged siRNA.
Abbreviation: AuNR, gold nanorod.
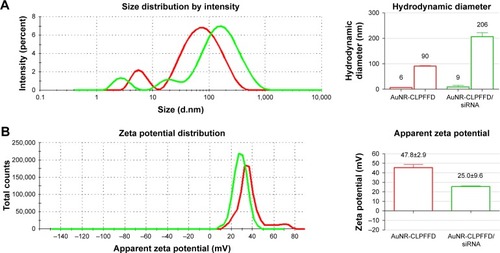
Figure 3 Effect of AuNR-CLPFFD and AuNR-CLPFFD/siRNA complexes on PC12 cell viability.
Notes: PC12 cells were treated with increasing concentrations of (A) AuNR-CLPFFD and (B) AuNR-CLPFFD/siRNA complexes for 24 hours. The MTS assay shows decreased mitochondrial activity only in the cells that were treated with the highest concentrations (0.5–1 nM) of the compounds. Comparisons were analyzed using Student’s t-test (*P<0.05 compared to the control; n=6 for the respective experimental groups).
Abbreviations: AuNR, gold nanorod; MTS, 3-(4,5-Dimethylthiazol-2-yl)-5-(3-carboxymethoxyphenyl)-2-(4-sulfophenyl)-2H-tetrazolium.
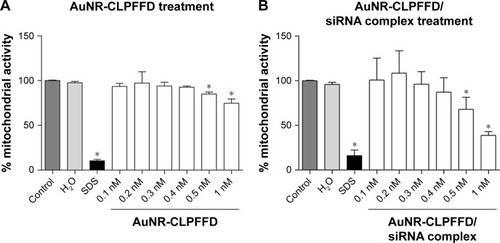
Figure 4 Cellular uptake of the AuNR-CLPFFD/siRNA complex and knockdown of PARP-1 protein.
Notes: (A) PC12 cells treated with 1) nuclease-free H2O (CS), 2) naked PARP-1 siRNA (siRNA, 0.1 nM), 3) FuGENE® loaded with siRNA (3:1) (FuGene), or 4) AuNR-CLPFFD/siRNA complex (Complex, 0.1 nM) 1 hour after the treatment. Images were obtained by confocal microscopy: Hoechst 33342-stained nuclei (blue), early endosomes (green), fluorescent siRNA label dye 647 (red). The images shown represent the merging of three pictures taken at 1 µm intervals. Scale bar: 50 µm; magnification, 60×. The image suggests the colocalization of siRNA with the dotted pattern of early endosomes. (B) Relative quantification of siRNA fluorescence. (C) Quantification of PARP-1 protein levels in PC12 cells. The results show that the complex was able to transport the siRNA into the cells at 1 hour post-treatment. The siRNA inhibited the expression of PARP-1 protein 24 hours post-treatment (*P<0.03 compared to the saline control; F-ANOVA followed by Dunnett’s post hoc test [n=4 for each group]).
Abbreviations: AuNR, gold nanorod; CS, cesarean-delivered control rats.
![Figure 4 Cellular uptake of the AuNR-CLPFFD/siRNA complex and knockdown of PARP-1 protein.Notes: (A) PC12 cells treated with 1) nuclease-free H2O (CS), 2) naked PARP-1 siRNA (siRNA, 0.1 nM), 3) FuGENE® loaded with siRNA (3:1) (FuGene), or 4) AuNR-CLPFFD/siRNA complex (Complex, 0.1 nM) 1 hour after the treatment. Images were obtained by confocal microscopy: Hoechst 33342-stained nuclei (blue), early endosomes (green), fluorescent siRNA label dye 647 (red). The images shown represent the merging of three pictures taken at 1 µm intervals. Scale bar: 50 µm; magnification, 60×. The image suggests the colocalization of siRNA with the dotted pattern of early endosomes. (B) Relative quantification of siRNA fluorescence. (C) Quantification of PARP-1 protein levels in PC12 cells. The results show that the complex was able to transport the siRNA into the cells at 1 hour post-treatment. The siRNA inhibited the expression of PARP-1 protein 24 hours post-treatment (*P<0.03 compared to the saline control; F-ANOVA followed by Dunnett’s post hoc test [n=4 for each group]).Abbreviations: AuNR, gold nanorod; CS, cesarean-delivered control rats.](/cms/asset/caf1b740-cb99-447d-b503-328d9f7d12ba/dijn_a_12194228_f0004_c.jpg)
Figure 5 Gold content of neonatal rat brain.
Notes: Distribution of gold (ng/g dry tissue) in brain samples from AuNR-CLPFFD/siRNA complex treated neonatal rats after a single dose (2.2 nM, ip). Samples were obtained at 30 minutes, 1 hour, and 2 hours after treatment. The result shows that gold accumulates in the brains of the neonatal rats after passing through the BBB. No differences between CS and AS animals were observed. ANOVA followed by Dunnett’s post hoc test (n=6 for each group).
Abbreviations: AuNR, gold nanorod; ip, intraperitoneal; CS, cesarean-delivered control rats; AS, asphyxia-exposed rats; BBB, blood–brain barrier.
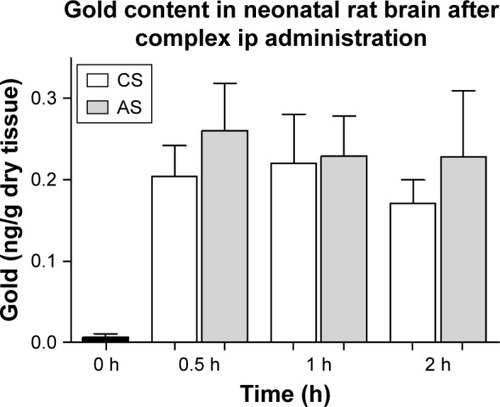
Figure 6 In vivo knockdown of PARP-1 in AS-exposed animals.
Notes: Administration of a single dose of AuNR-CLPFFD/siRNA complex (ip) to AS-exposed animals. The animals were treated with 1) saline solution (Saline), 1) naked siRNA (siRNA), or 3) AuNR-CLPFFD/siRNA complex (Complex) 1 hour after birth. Total protein extracts were obtained 24 hours after treatment. PARP-1 protein levels in the mesencephalon, hippocampus, and telencephalon were quantified by Western blotting. The quantification shows that treatment with the AuNR-CLPFFD/siRNA complex decreased PARP-1 levels in the mesencephalon and hippocampus (aP<0.05 compared to the saline treatment, Student’s t-test; n=6 for each condition).
Abbreviations: AuNR, gold nanorod; ip, intraperitoneal; AS, asphyxia-exposed rats.
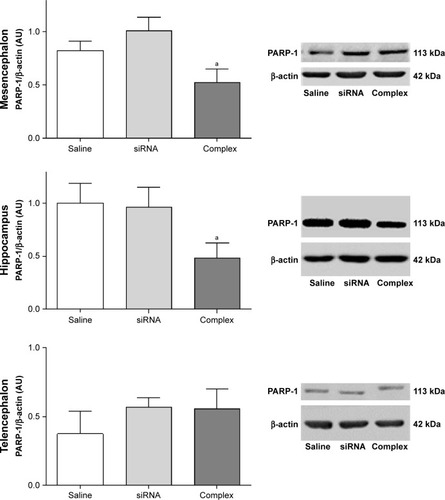
Figure S1 AuNR-CLPFFD/siRNA complex formation evaluated by changes of the electrophoretic mobility pattern.
Notes: (A) Agarose electrophoresis under non-denaturing conditions. Lane 1 shows the migration pattern of 0.6 µg of free siRNA (0.2 nmol). Lane 2 shows the conjugation of 9 nM AuNR-CLPFFD with 0.6 µg of siRNA. Lane 3 shows 0.9 nM of AuNR-CLPFFD with 0.6 µg of siRNA and lane 4 shows 0.2 nM of AuNR-CLPFFFD with 0.6 µg of siRNA. These results show that at 9 nM of AuNR-CLPFFD, the nanoparticles can form electrostatic interaction with siRNA molecules, retaining the siRNA molecules forming the AuNR-CLPFFD/siRNA complex, allowing to observe a difference in the electrophoretic mobility of free siRNA molecules. In contrast, lanes 3 and 4 show that nanoparticles were not concentrated enough, leaving high amount of free siRNA molecules in solution and conserving the migration pattern of free siRNA. (B) A schematic representation of the siRNA molecules with AuNR-CLPFFD.
Abbreviation: AuNR, gold nanorod.
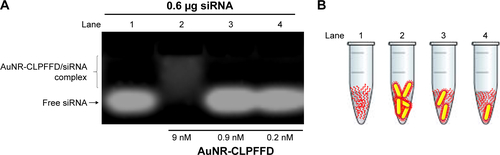
Figure S2 Cellular uptake is by endocytosis.
Notes: PC12 cells were treated with 1) nuclease-free H2O at 37°C (CS), 2) 0.1 nM AuNR-CLPFFD/siRNA complex at 37°C (Complex), or 3) 0.1 nM AuNR-CLPFFD/siRNA complex at 4°C (Complex) for 1 hour. The mean of the quantified fluorescence was measured by flow cytometry expressed in arbitrary units. The result shows that the fluorescent uptake was decreased when cells were incubated al 4°C, demonstrating that the uptake mechanism was by endocytosis. Inset shows a representative population of analyzed cells (*P<0.05 compared to the saline control); F-ANOVA followed by Bonferroni’s multiple comparison test (n=3 for each group).
Abbreviations: AuNR, gold nanorod; CS, cesarean-delivered control rats.
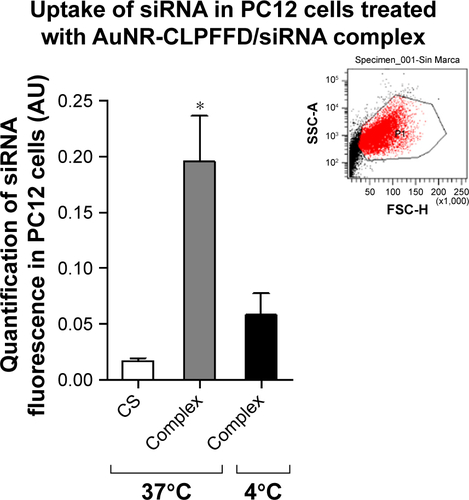
Figure S3 Single cell image of cellular uptake of the AuNR-CLPFFD/siRNA complex.
Notes: PC12 cells were treated with 0.1 nM AuNR-CLPFFD/siRNA complex for 1 hour. Images were obtained by confocal microscopy: (A) transmitted light microphotograph, (B) Hoechst 33342 stained nuclei (blue), (C) early endosomes (green), (D) fluorescent siRNA label dye647 (red), and (E) merge of (B, C, and D) images. The result shows the colocalization of early endosome vesicles and the AuNR-CLPFFD/siRNA complex. Images are the merge of three pictures taken every 1 µm. Scale bar: 20 µm; 60× optic, 3.1 optic zoom.
Abbreviation: AuNR, gold nanorod.
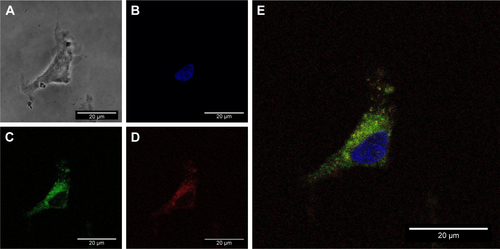
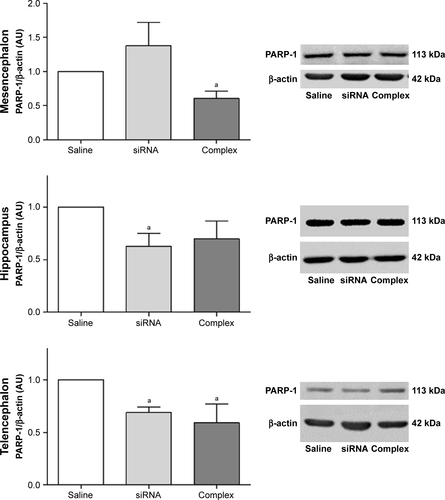
Figure S4 In vivo knockdown of PARP-1 in control animals.
Notes: Administration of a single dose of AuNR-CLPFFD/siRNA complex (ip) to control animals. Treatment: 1) saline solution (Saline); 2) naked siRNA (siRNA), or 3) AuNR-CLPFFD/siRNA complex (Complex), 1 hour after birth. Total protein extracts were obtained 24 hours after the treatment. PARP-1 protein levels were quantified by Western blots, in mesencephalon, hippocampus, and telencephalon. The quantification showed that in mesencephalon and telencephalon, the AuNR-CLPFFD/siRNA complex treatment decreased PARP-1 levels. We also showed the decreasing levels of PARP-1 in rats treated with naked siRNA administration. Further study will be needed to explain the nature of this effect (aP<0.05 compared to the saline control; Student’s t-test; n=6 for each condition).
Abbreviations: AuNR, gold nanorod; ip, intraperitoneal.