Figures & data
Figure 1 Characterization of conjugates and drug delivery system.
Notes: (A) Citation1H-NMR spectra of PEG-PAMAM, RGDyC-PAMAM and RGDyC-mPEG-PAMAM, insert was the characteristic peaks of RGDyC at 6.70 and 7.00 ppm. (B) FT-IR spectra of RGDyC, RGDyC-PAMAM and RGDyC-mPEG-PAMAM. (C) Transmission electron microscopy images of PEG-PAMAM, RGDyC-PAMAM and RGDyC-mPEG-PAMAM. Scale bar, 200 nm. (D) In vitro release profiles of ATO-sol, PEG-PAMAM/ATO and RGDyC-mPEG-PAMAM/ATO in pH 7.4 and pH 5.5, insert was the release from 0 h to 4 h.
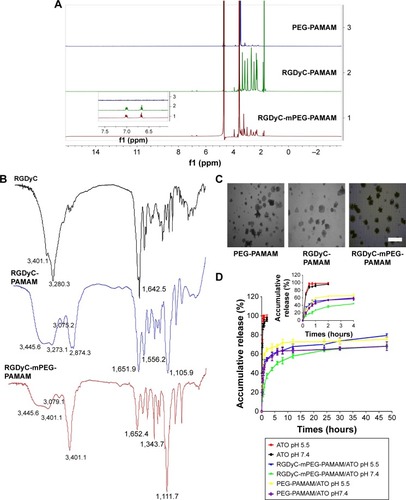
Table 1 The zeta potential and size distribution of PAMAM, PEG-PAMAM, RGDyC-PAMAM, and RGDyC-mPEG-PAMAM (n=3)
Figure 2 Toxicity of conjugates and drug delivery system.
Notes: (A) Hemolysis assay of different PAMAM-conjugates after 1 h incubation. The viabilities of C6 cells (B) and HBMEC (C) cells after being treated with PAMAM, RGDyC-PAMAM, PEG-PAMAM and RGDyC-mPEG-PAMAM. *P<0.01 vs PAMAM, RGDyC-PAMAM; **P<0.01 vs PAMAM. The viabilities of C6 cells and HBMEC cells (D) after being treated with ATO-sol. The viabilities of C6 cells (E) after being treated with ATO, PEG-PAMAM/ATO and RGDyC-mPEG--PAMAM/ATO. (n=6).
Abbreviation: HBMEC, human brain microvascular endothelial cells.
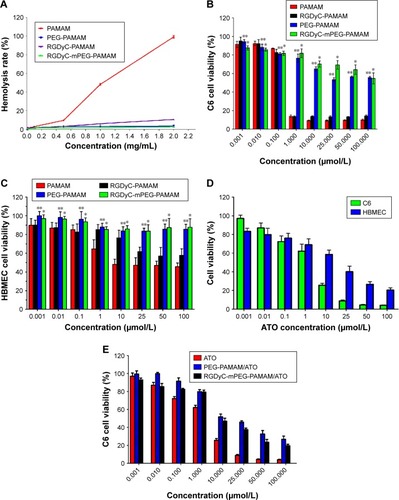
Figure 3 Characterization of intracellular disposition and cellular uptake.
Notes: (A) Confocal images of C6 cells incubation for 2h with (a) PAMAM; (b) PEG-PAMAM; (c) RGDyC-mPEG-PAMAM; (d) RGDyC-PAMAM. For each group, the images from up to down showed the cells staining with ① DAPI, ② FITC fluorescence, and ③ overlays. Scale bar, 50 μm. (B) Flow cytometry profiles of C6 cells incubated with FITC modified (a) PEG-PAMAM, (b) RGDyC-PAMAM and (c) RGDyC-mPEG-PAMAM incubated for 0.5h, 1h, 2h, 4h. (C) The C6 cell viability of ATO, PEG-PAMAM/ATO and RGDyC-mPEG-PAMAM/ATO after transporting across the BBB, n=3. **P<0.01 vs ATO, ##P<0.01 vs PEG-PAMAM/ATO. (D) The transportation ratios of FITC, PEG-PAMAM-FITC and RGDyC-mPEG-PAMAM-FITC. **P<0.01 vs PEG-PAMAM-FITC, ##P<0.01 vs FITC.
Abbreviations: BBB, blood-brain barrier; FITC, fluorescein isothiocyanate.
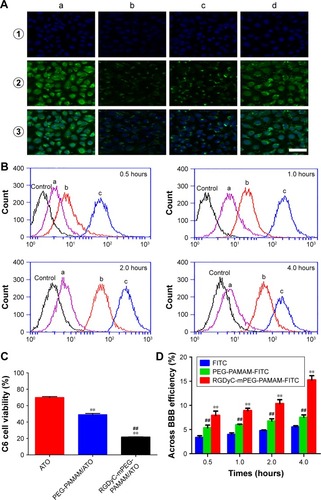
Figure 4 The effect of ATO formulation to C6 cells cycle.
Note: C6 cells cycle perturbations induced by ATO formulations in culture medium for 24 h directly (A) and C6 cells cycle perturbations after transporting across the blood-brain barrier model in vitro (B).
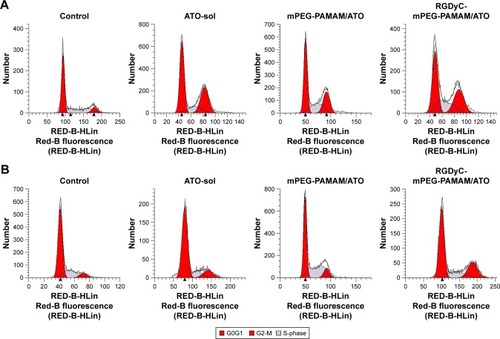
Table 2 The apoptosis assay of C6 cells induced by ATO formulations in culture medium for 24 hours with or without across BBB model in vitro (n=3)
Table 3 Pharmacokinetic parameters of ATO after intravenous administration of ATO, PEG-PAMAM/ATO, and RGDyC-mPEG-PAMAM/ATO (n=5)
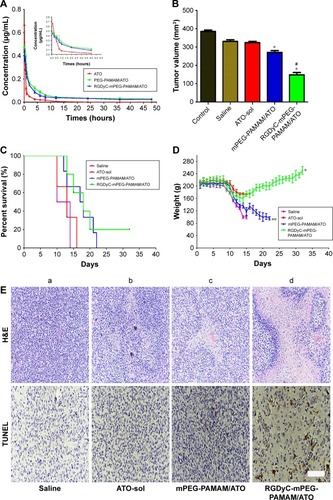
Figure 5 Pharmacokinetic and efficacy study.
Notes: (A) Mean concentration-time of ATO in plasma after vein injection of ATO-sol, PEG-PAMAM/ATO and RGDyC-mPEG-PAMAM/ATO, (n=5). (B) The tumor volume inhibitory ratio (%) in the C6 glioma bearing rats after IV administration of ATO-sol, PEG-PAMAM/ATO and RGDyC-mPEG-PAMAM/ATO (1 mg ATO equivalent/kg body weight). *P<0.01 vs saline, ATO-sol; #P<0.01 vs ATO-sol. (C) Kaplan–Meier survival curves of glioma-bearing mice treated with saline or ATO formulations. (D) mean body weight of the mice in different groups during the treatment in vivo therapeutic study. *P<0.01 vs saline, ATO-sol; **P<0.01 vs ATO-sol. (E) Tumor H&E histology images and Tunel images of the mice after administration of (a) saline, (b) ATO-sol, (c) PEG-PAMAM/ATO and (d) RGDyC-mPEG-PAMAM/ATO for 8 days. Scale bar, 100 μm.