Figures & data
Figure 1 SEM images of FSCP/COS NFMs with different FSCP/COS mass ratios of 1:3 (A), 1:2 (B), 1:1 (C), 2:1 (D), and 3:1 (E); TEM image of FSCP/COS NFM with FSCP/COS at a mass ratio of 2:1 (F).
Abbreviations: COS, chito-oligosaccharides; FSCP, fish scale collagen peptides; NFMs, nanofibrous membranes.
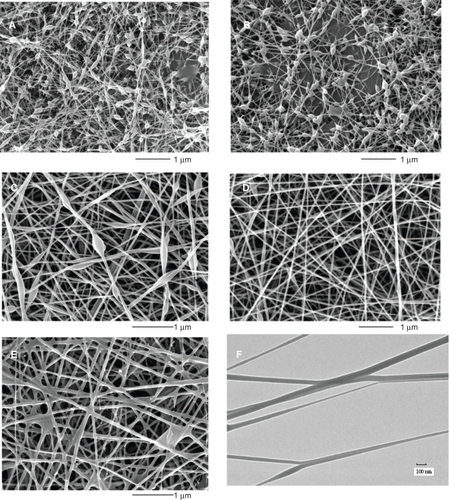
Figure 2 FTIR spectra of COS, FSCP, PVA, and FSCP/COS NFMs.
Abbreviations: COS, chito-oligosaccharides; FSCP, fish scale collagen peptides; NFM, nanofibrous membrane; PVA, polyvinyl alcohol.
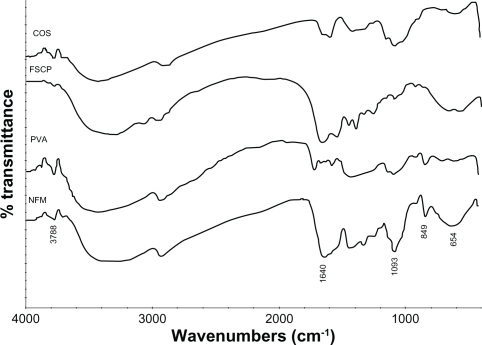
Figure 3 Antibacterial activities of different concentration of FSCP/COS NFMs against S. aureus (▴) and E. coli (▪) (A); Antibacterial activities of different NFMs at 0.8 g per sample against S. aureus (B), and E. coli (C).
Note: *P < 0.05 compared with FSCP NFMs.
Abbreviations: COS, chito-oligosaccharides; FSCP, fish scale collagen peptides; NFM, nanofibrous membranes.
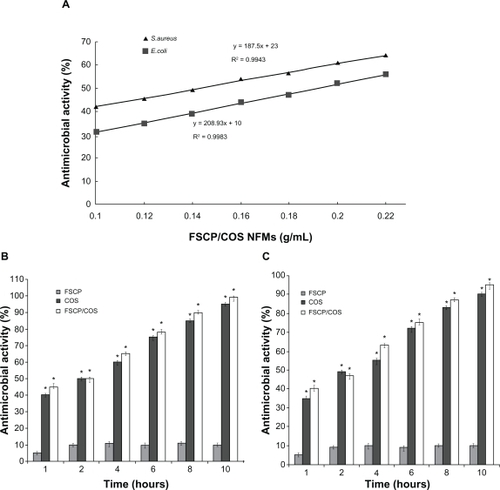
Figure 4 SEM images of bacteria attached on the surfaces of FSCP/COS NFMs after 2 hours of incubation.
Abbreviations: COS, chito-oligosaccharides; FSCP, fish scale collagen peptides; NFMs, nanofibrous membranes.
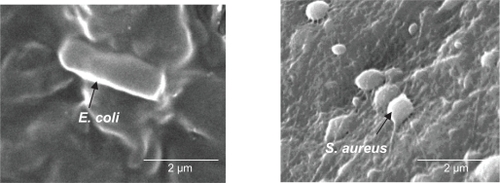
Figure 5 Photomicrographs of E. coli (A), and S. aureus (B) treated with FSCP/COS NFMs. 1, 2, 3, 4, and 5 refer to the samples at 0, 15, 30, 45, and 60 minutes, respectively.
Abbreviations: COS, chito-oligosaccharides; FSCP, fish scale collagen peptides; NFMs, nanofibrous membranes.
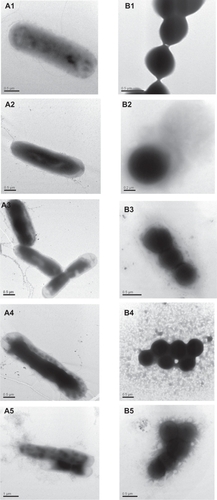
Figure 6 Release of cell materials absorbing at 260 nm (A) and 280 (B) from E. coli or S. aureus suspensions treated with FSCP/COS NFMs, and PVA NFM treatment as a control.
Abbreviations: COS, chito-oligosaccharides; FSCP, fish scale collagen peptides; NFMs, nanofibrous membranes; PVA, polyvinyl alcohol.
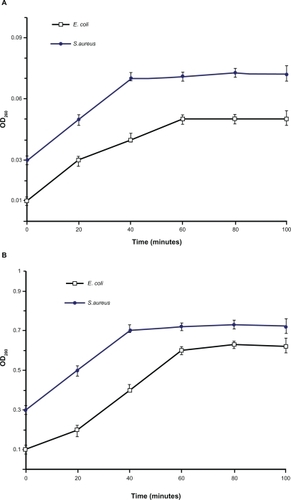
Figure 7 Photomicrographs of human skin fibroblasts after growing for 1 day and 7 days, respectively, with treatments of PVA (A, B), COS (C, D), FSCP (E, F), and FSCP/COS (G, H).
Abbreviations: COS, chito-oligosaccharides; FSCP, fish scale collagen peptides; NFM, nanofibrous membranes; PVA, polyvinyl alcohol.
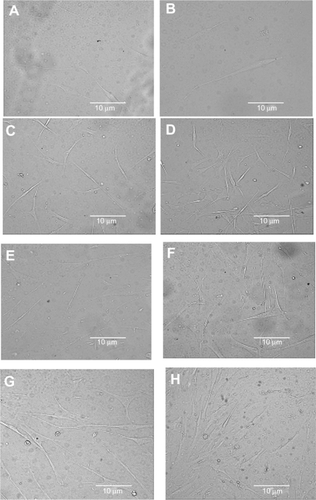
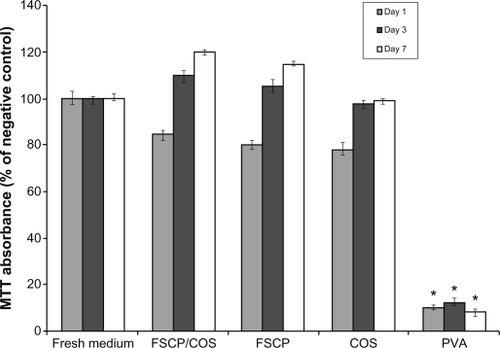
Figure 8 Fibroblast cell viability using the MTT assays. Fresh medium was used as a negative control and PVA as a positive control. The absorbance was normalized against the negative control at each time interval, which is taken as 100%.
Note: *P < 0.05 compared with the negative control.
Abbreviations: COS, chito-oligosaccharides; FSCP, fish scale collagen peptides; MTT, 3-(4,5-Dimethylthiazol-2-yl)-2,5-diphenyltetrazolium bromide; NFMs, nanofibrous membranes; PVA, polyvinyl alcohol.