
Figures & data
Table 1 Synthesis conditions of the protocols used to prepare TeNWs
Figure 1 Solutions of GREEN-TeNWs after the reaction. The colorless solution without starch (left) and dark solution containing starch (right).
Abbreviation: GREEN-TeNWs, green-synthesized tellurium nanowires.
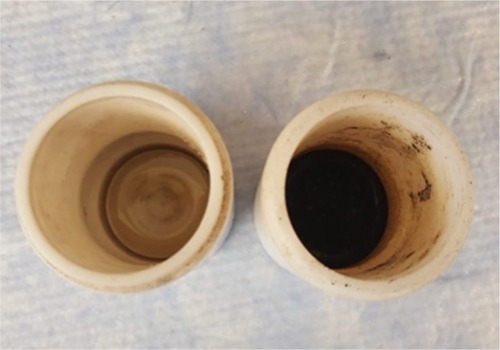
Table 2 Data from transmission electron microscopy for size and coating
Figure 2 Transmission electron microscopy images of TeNWs. CHEM-TeNWs with a low degree of aggregation were found dispersed within the solution (A) and (B). GREEN-TeNWs (C and D) showed a higher degree of aggregation, and the presence of an organic coating was observed.
Abbreviations: CHEM-TeNWs, chemically synthesized TeNWs; GREEN-TeNWs, green-synthesized TeNWs; TeNWs, tellurium nanowires.
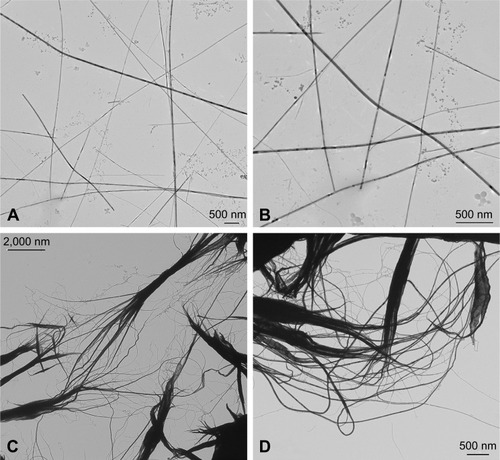
Figure 3 SEM images of CHEM-TeNWs (A and B) and GREEN-TeNWs (C and D). GREEN-TeNWs grew with a star-shaped structure, while CHEM-TeNWs had different morphologies.
Abbreviations: CHEM-TeNWs, chemically synthesized TeNWs; GREEN-TeNWs, green-synthesized TeNWs; SEM, scanning electron microscopy; TeNWs, tellurium nanowires.
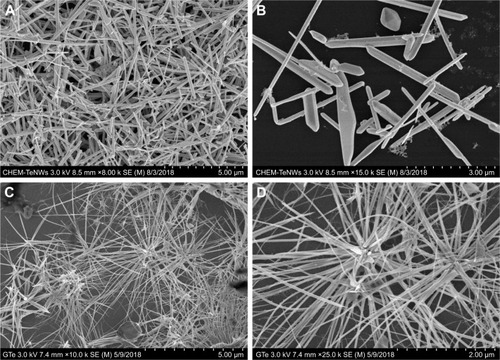
Figure 4 Energy-dispersive X-ray of TeNWs. CHEM-TeNWs were characterized (A) as well as GREEN-TeNWs in both the metallic core (B) and the surrounding coating (C).
Abbreviations: CHEM-TeNWs, chemically synthesized TeNWs; GREEN-TeNWs, green-synthesized TeNWs; TeNWs, tellurium nanowires.
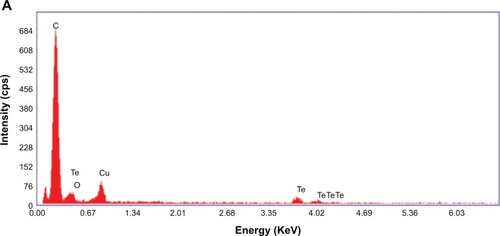
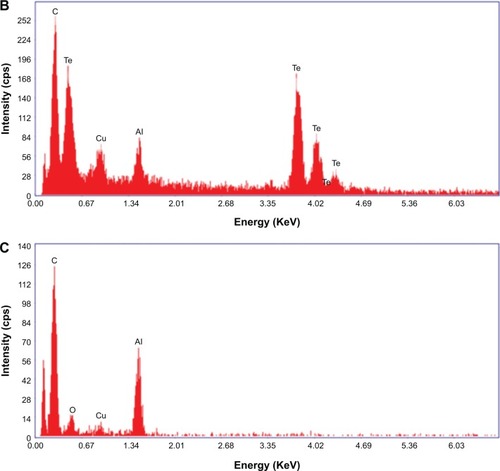
Figure 5 FT-IR spectra of (A) CHEM-TeNWs, (B) GREEN-TeNWs, and (C) potato starch.
Abbreviations: CHEM-TeNWs, chemically synthesized TeNWs; FI-TR spectra, Fourier-transform infrared spectra; GREEN-TeNWs, green-synthesized TeNWs; TeNWs, tellurium nanowires.
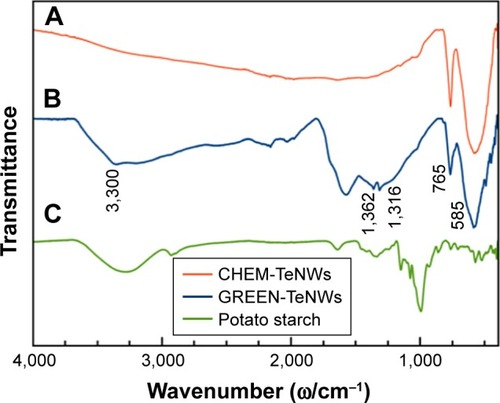
Table 3 Hexagonal lattice parameters calculated for GREEN-TeNWs and CHEM-TeNWs
Figure 6 Comparison between the experimental XRD patterns for GREEN-TeNWs and CHEM-TeNWs and the calculated XRD patterns for bulk hexagonal Te (h-Te).Citation68 The diffraction peaks marked with (*) may be related to Te-based oxides.
Abbreviations: CHEM-TeNWs, chemically synthesized TeNWs; GREEN-TeNWs, green-synthesized TeNWs; TeNWs, tellurium nanowires; XRD, X-ray powder diffraction.
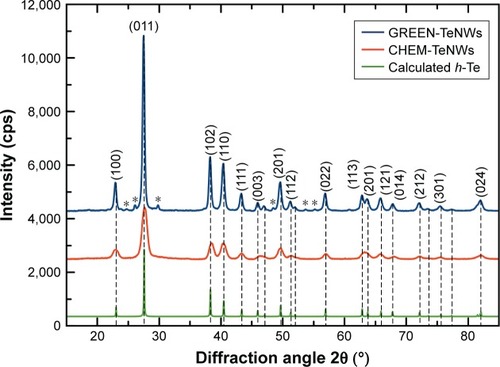
Figure 7 Wide scans recorded on both compounds synthesized through the green and chemical routes.
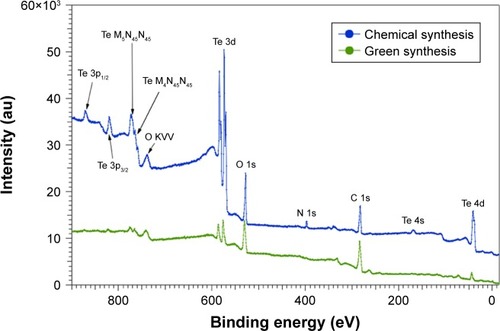
Table 4 Chemical composition (in percentage atomic concentration) extracted from the Te 3d, O 1s, N 1s, and C 1s core level peaks
Figure 8 XPS spectra recorded at the Te 3d core levels for samples synthesized through the chemical and green routes.
Abbreviation: XPS, X-ray photoelectron spectroscopy.
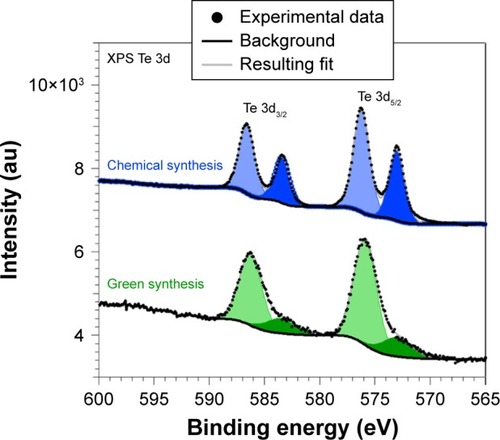
Figure 9 XPS spectra recorded at the C 1s (left) and O 1s (right) core levels for samples synthesized through the chemical and green routes.
Abbreviation: XPS, X-ray photoelectron spectroscopy.
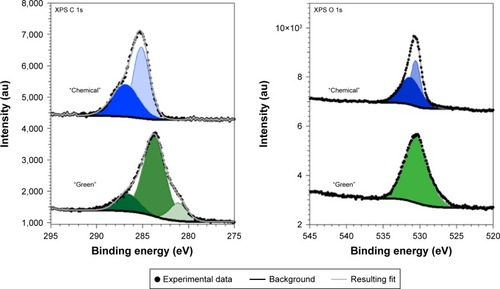
Figure 10 MTS assays on HDF (A, B) and melanoma (C, D) cells in the presence of CHEM-TeNWs (A, C) and GREEN-TeNWs (B, D) at concentrations ranging from 5 to 100 μg/mL. N=3. Data are presented as mean ± SD; *P<0.01, **P<0.005.
Abbreviations: CHEM-TeNWs, chemically synthesized TeNWs; GREEN-TeNWs, green-synthesized TeNWs; HDF, human dermal fibroblasts; TeNWs, tellurium nanowires.
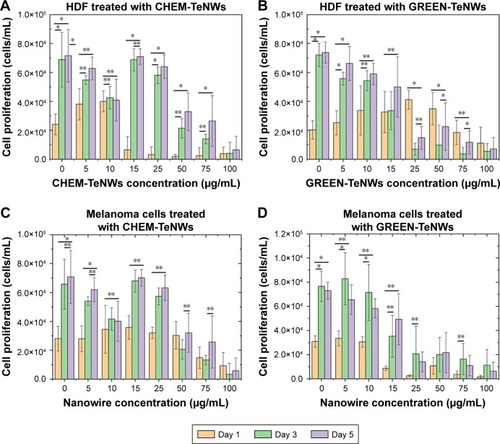
Figure 11 Comparison between CHEM-TeNWs and GREEN-TeNWs for HDF (A) and melanoma (B) cells at the fifth day of experiment. Data from MTS assays on HDF and melanoma cells in the presence of TeNWs.
Abbreviations: CHEM-TeNWs, chemically synthesized TeNWs; GREEN-TeNWs, green-synthesized TeNWs; HDF, human dermal fibroblasts; TeNWs, tellurium nanowires.
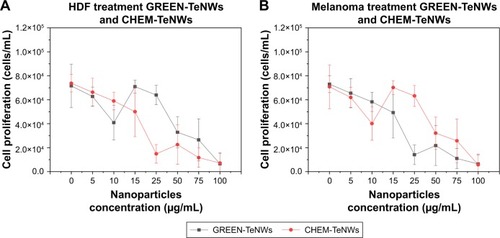
Table 5 IC50 values for both CHEM-TeNWs and GREEN-TeNWs in experimental assays with HDF and melanoma cells after 5 days of experiments
Figure 12 Interaction between HDF cells and GREEN-TeNWs. Interaction between 50 μg/mL (A, B), 0 μg/mL (C), and 100 μg/mL (D) of GREEN-TeNWs and HDF cells was analyzed.
Abbreviations: GREEN-TeNWs, green-synthesized TeNWs; HDF, human dermal fibroblasts; TeNWs, tellurium nanowires.
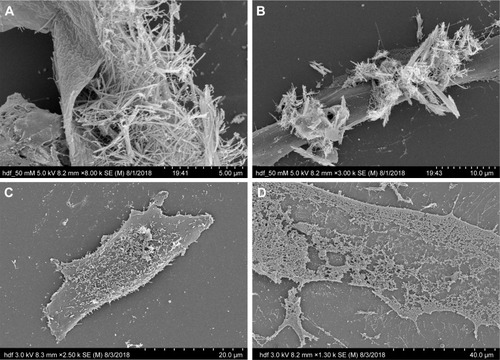
Figure 13 Interaction between melanoma cells and GREEN-TeNWs. Bubbling (A) and rupture (B and C) of the cell membrane were observed in comparison with the control (D).
Abbreviation: GREEN-TeNWs, green-synthesized tellurium nanowires.
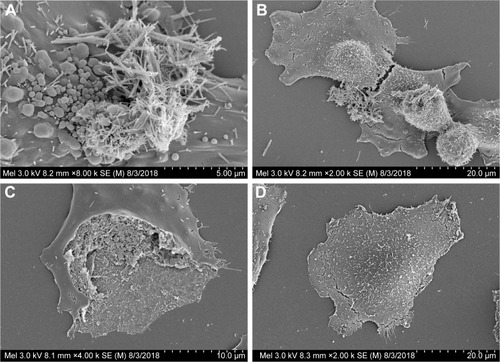
Figure 14 Optical microscopy characterization of HDF (A, B) and human melanoma (C, D) cells cultured in the presence of both CHEM-TeNWs and GREEN-TeNWs for 24 hours.
Abbreviations: CHEM-TeNWs, chemically synthesized TeNWs; GREEN-TeNWs, green-synthesized TeNWs; HDF, human dermal fibroblasts; TeNWs, tellurium nanowires.
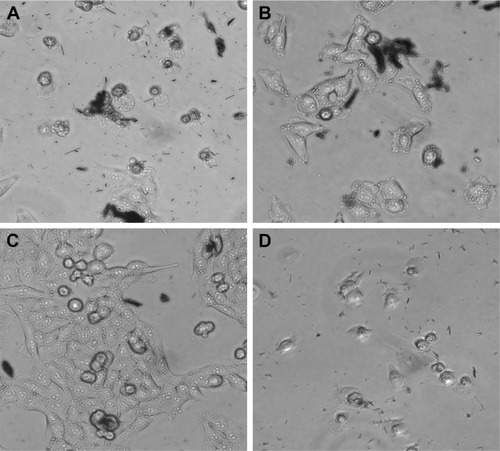
Figure S1 XRD pattern for GREEN-TeNWs.
Abbreviations: GREEN-TeNWs, green-synthesized tellurium nanowires; XRD, X-ray powder diffraction.
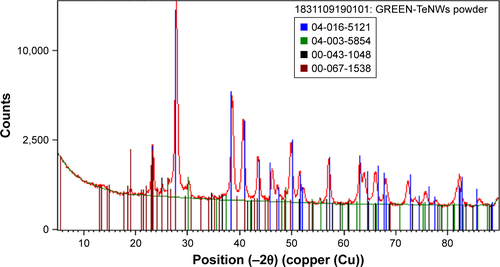
Figure S2 XRD pattern for GREEN-TeNWs.
Abbreviations: GREEN-TeNWs, green-synthesized tellurium nanowires; XRD, X-ray powder diffraction.
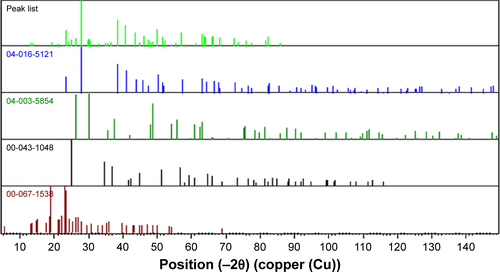
Figure S3 XRD pattern for GREEN-TeNWs.
Abbreviations: GREEN-TeNWs, green-synthesized tellurium nanowires; XRD, X-ray powder diffraction.
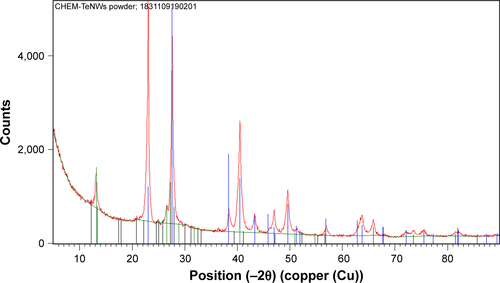
Figure S4 XRD pattern for GREEN-TeNWs.
Abbreviations: GREEN-TeNWs, green-synthesized tellurium nanowires; XRD, X-ray powder diffraction.
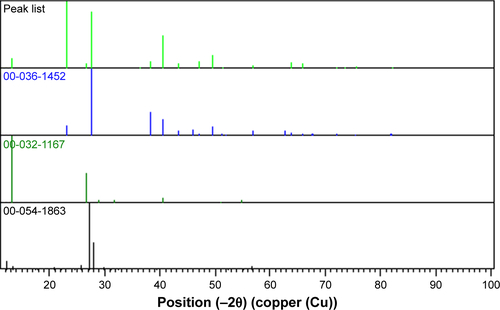
Table S1 Peak identification list for XRD pattern for GREEN-TeNWs
Table S2 List of identified patterns on XRD analysis of GREEN-TeNWs
Table S3 Peak identification list for XRD pattern for CHEM-TeNWs
Table S4 List of identified patterns on XRD analysis of CHEM-TeNWs