Figures & data
Figure 1 Nanoparticles exhibit spherical shapes. A) Polyol-made iron oxide powder consists of maghemite nanocrystals as shown by their broadened X-ray diffraction pattern. B) Fe2O3 iron oxide nanoparticle morphology was observed by transmission electron microscopy on a collection of as-produced particles (left image). A zoom on one representative particle is shown (right panel).
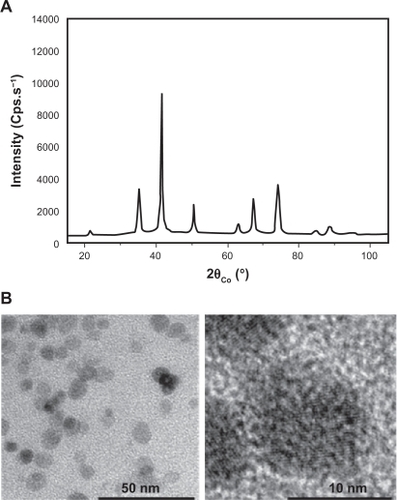
Table 1 Physical properties of iron oxide nanoparticle
Figure 2 Nanoparticle internalization in human endothelial cells. A and B) Human umbilical vein endothelial cells (HUVEC) were incubated with FITC-labelled nanoparticle (NP, 10 μg/mL, green) for the indicated times in serum-free medium. Nuclei were counterstained with 4,6-diamidino-2-phenylindole (DAPI) (blue) and samples were analyzed by confocal microscopy.
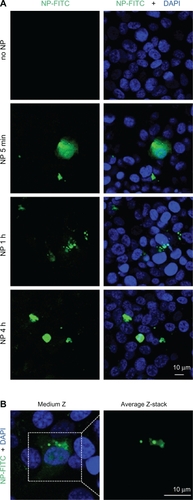
Figure 3 Subcellular localization of nanoparticles. Transmission electron microscopy was performed on human umbilical vascular endothelial cells (HUVEC) exposed to nanoparticles for the indicated times.
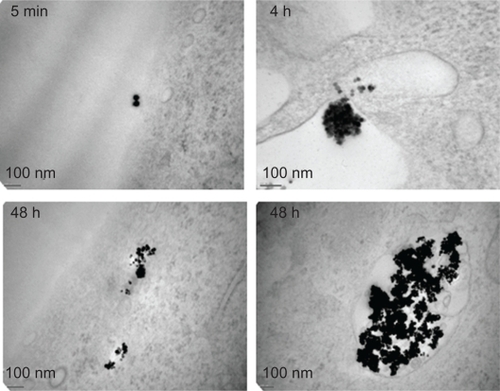
Figure 4 Effect of nanoparticles on endothelial cell viability. A) The number of viable cells was measured by 3-(4,5-dimethylthiazol-2-yl) diphenyltetrazolium bromide (MTT) when exposed to nanoparticles (NP) at the indicated times and concentrations. Results were expressed as a ratio to nonstimulated serum-free cultured cells for each time point. B) Cell toxicity was evaluated by LDH leakage and calculated as described in the method section, in human umbilical vein endothelial cells (HUVEC) exposed to 10 μg/mL of NP. C) Cells exposed to 10 μg/mL of NP were harvested for Western blot analysis at the indicated time points. Phosphorylation (p) of Akt and endothelial nitric oxide synthase (eNOS) was monitored, along with Akt, eNOS and Caspase 3. D) Reactive oxygen species (ROS) production was examined in NP (10 μg/mL)-exposed HUVEC at the indicated time points. Fluorescence values were normalized to the ones obtained in control conditions.
Notes: All results are representative of three independent experiments, **P < 0.01; *P < 0.05.
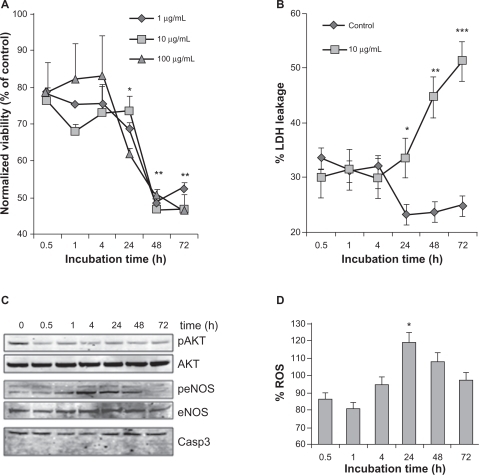
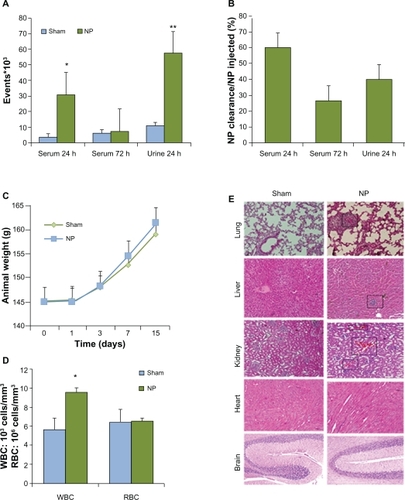
Figure 5 In vivo clearance and toxicity of nanoparticles. Six animals for each groups received saline (Sham) or nanoparticle (NP) (0.8 mg/kg NP) by intravenous injection. A and B) Blood and urine clearance profile of fluorescein isothiocyanate (FITC)-labeled NP was measured either by flow cytometry or spectrophotometry, respectively, after 24 and 72 hours. C) Animals were weighed during the course of control and NP treatment. D) Numbers of white and red blood cells (WBC, RBC) were examined in animals treated with control and NP for 14 days. E) Organs were collected 14 days post-treatment and processed for staining with hematoxylin and eosin.
Notes: **P < 0.01; *P < 0.05.