Figures & data
Figure 1 SEM images of the surface morphologies of different substrates: (A) PT, (B) NT, and (C) NT-T.
Note: Inserted images display the observed morphologies at high magnification.
Abbreviations: NT, nanotubes; NT-T, tetracycline-loaded nanotubes; PT, pure titanium; SEM, scanning electron microscopy.
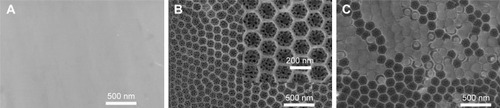
Table 1 The chemical compositions of the PT, NT, and NT-T substrates by XPS
Figure 2 The XPS patterns of the PT, NT, NT-T substrates: (A) Ti, (B) O, (C) N, and (D) C.
Abbreviations: NT, nanotubes; NT-T, tetracycline-loaded nanotubes; PT, pure titanium; XPS, X-ray photoelectron spectroscopy.
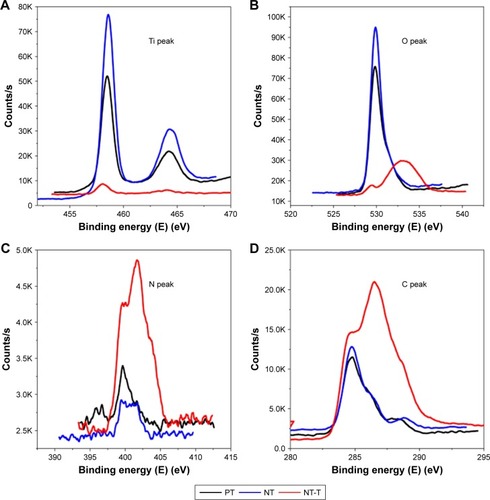
Figure 3 The surface contact angles and water drop profiles of the PT, NT, and NT-T substrates.
Notes: The contact angle is expressed as a measure of hydrophilicity of different substrates. The error bars represent means ± SD (n=3). *A significant difference compared with PT (P<0.05).
Abbreviations: NT, nanotubes; NT-T, tetracycline-loaded nanotubes; PT, pure titanium.
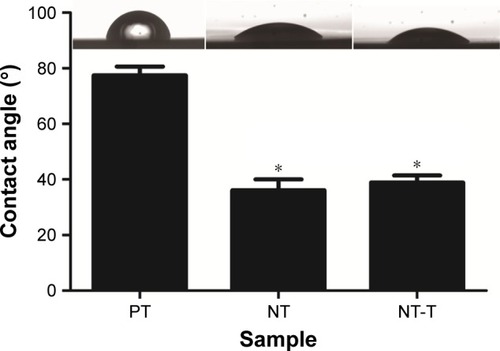
Figure 4 The fraction release of tetracycline from NT-T substrates in vitro (n=3).
Abbreviation: NT-T, tetracycline-loaded nanotubes.
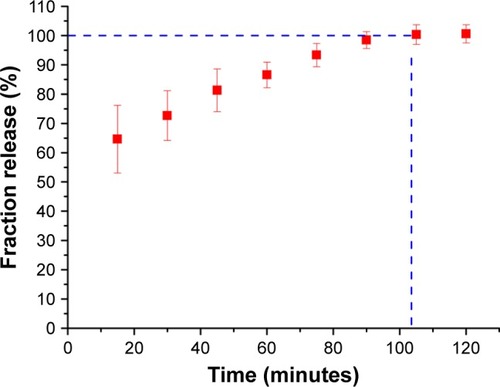
Figure 5 Evaluation of antimicrobial activity of different substrates for 3 hours.
Notes: (A) SEM of bacterial adhesion on the surfaces of the PT, NT, and NT-T for 3 hours (a–c); Fluorescence microscope images of bacterial colonies adhered on the PT, NT, and NT-T (d–f). (B) Bacterial CFU from different substrates for 3 hours. The error bars represent means ± SD (n=3). *A significant difference compared with PT (P<0.05). #A significant difference compared with NT (P<0.05).
Abbreviations: CFU, colony-forming units; NT, nanotubes; NT-T, tetracycline-loaded nanotubes; PT, pure titanium; SEM, scanning electronic microscopy.
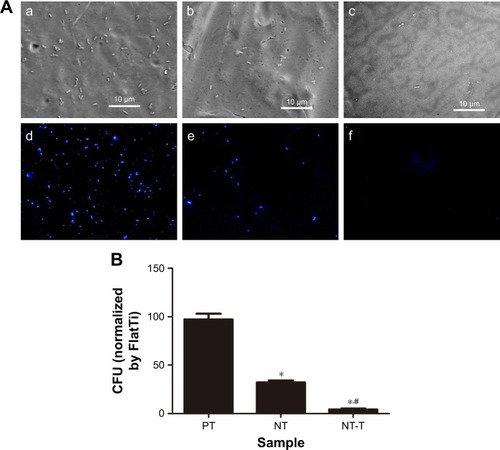
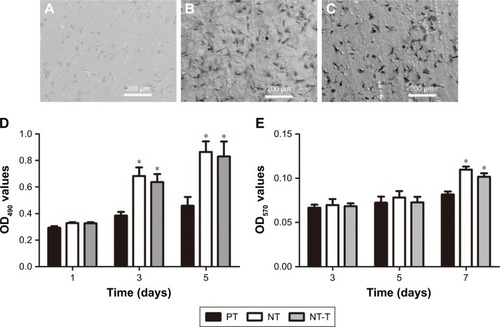
Figure 6 BMSCs on the substrates.
Notes: (A–C) The comparison of bacterial colonies adhered on the PT, NT, and NT-T at the 48-hour point. (D) MTT assay. Formazan absorbance expressed as a measure of cell proliferation from BMSCs cultured on different substrates for 1, 3, and 5 days. (E) Alkaline phosphatase activity of BMSCs cultured on different substrates for 3, 5, and 7 days. The error bars represent means ± SD (n=3). *A significant difference compared with PT (P<0.05).
Abbreviations: BMSCs, bone marrow stromal cells; NT, nanotubes; NT-T, tetracycline-loaded nanotubes; PT, pure titanium.