Figures & data
Table 1 Primary antibodies
Table 2 Information of primer sequences
Figure 1 Preparation and characterization of iPSCs.
Notes: (A) A time-course schema of reprogramming hUCB mononuclear cells. (B) Preparation of MEF (a), and passage of iPSCs colonies (b) with stem cell passaging tool (c) to adapt them to multicelled growth conditions (d). (C) Immunofluorescent staining images of Sox2, SSEA4, TRA-1–60 (red), Oct4, Nanog (green), and DAPI (blue) of iPSCs. Scale bar =100 µm.
Abbreviations: DAPI, 4′,6-Diamidino-2-Phenylindole; hUCB, human umbilical cord blood; iPSCs, induced pluripotent stem cells; MEF, mice embryonic fibroblast; Nanog, homeobox protein NANOG; Oct4, octamer-binding transcription factor 4; SSEA4, stage specific embryonic antigen 4; Sox2, SRY (sex determining region Y)-box 2; TRA, terato-related antigen.
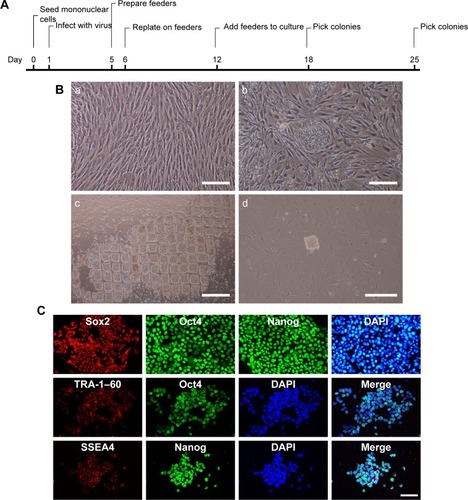
Figure 2 Preparation and characterization of iPSCs-NSCs and ASCs.
Notes: (A) The EBs (a) were cultured to allow the formation of self-organized neuroepithelium (b) that will give rise to iPSCs-NSCs (c). (B) Immunofluorescent staining images of Tuj1 (green), GFAP (red), O4 (red), and DAPI (blue) of iPSCs-NSCs. (C) ASCs (a) express the peripheroneural markers S100 (green) (b) and DAPI (blue) (c and d). Scale bar =100 µm.
Abbreviations: ASCs, activated Schwann cells; DAPI, 4′,6-Diamidino-2-Phenylindole; EBs, embryoid bodies; GFAP, glial fibrillary acidic protein; iPSCs-NSCs, induced pluripotent stem cells-derived neural stem cells; O4, oligodendrocyte marker O4; Tuj1, Class III β-tubulin.
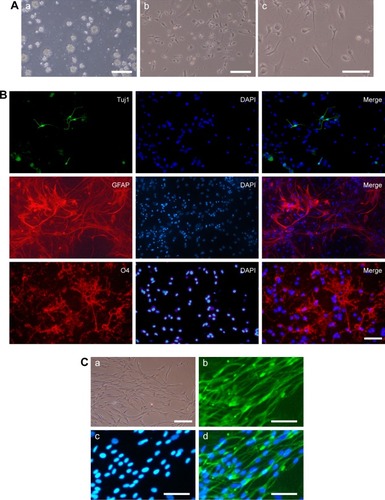
Figure 3 Preparation and characterization of tissue engineering scaffolds.
Notes: PCL with (A) or without ASCs and iPSCs-NSCs (B).
Abbreviations: ASCs, activated Schwann cells; iPSCs-NSCs, induced pluripotent stem cells-derived neural stem cells; PCL, polycaprolactone.
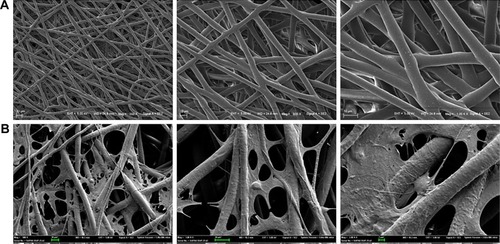
Figure 4 Axonal regeneration and remyelination of transplanted cells in injured spinal cord.
Notes: (A) Spinal cord transection and transplantation. Scale bar =0.5 cm. (B) Gross morphology and cavity formation of spinal cord tissue. (C) H&E staining of Group 1 (a), Group 2 (b), Group 3 (c), and Group 4 (d). Arrows: infiltrated cells in spinal cord. Scale bar =100 µm.
Abbreviation: H&E, hematoxylin–eosin.
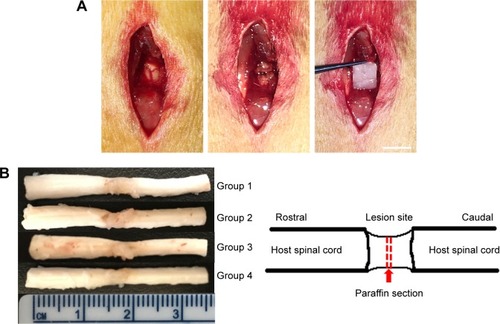
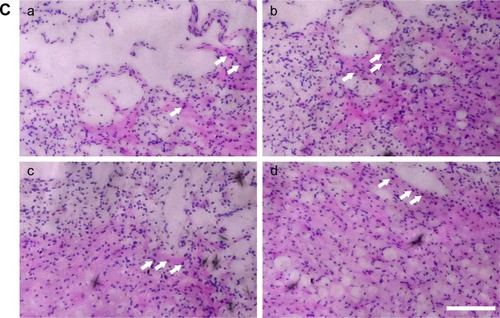
Figure 5 Functional analysis.
Notes: BBB scores of each treated group. *P<0.05.
Abbreviation: BBB, Basso, Beattie, and Bresnahan.
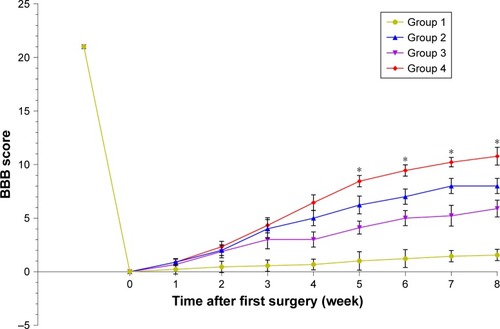
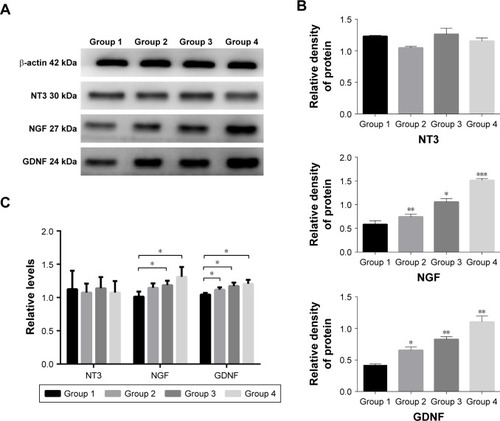
Figure 6 Analysis of NGF and neurotrophic factors.
Notes: The protein expression of NGF and GDNF (A) was increased in Group 2, Group 3, and Group 4 (B). The gene expression levels of NGF and GDNF were consistent with the protein expression levels (C). *P<0.05, **P<0.01, ***P<0.005.
Abbreviations: GDNF, glial cell-derived neurotrophic factor; NGF, nerve growth factor; NT3, neurotrophin 3.