Figures & data
Figure 1 Schematic representation of experimental design outlining the phases of STZ-administration along with the PPE-AuNP application.
Abbreviations: PPE-AuNP, pomegranate peel extract-stabilized gold nanoparticle; STZ, streptozotocin.
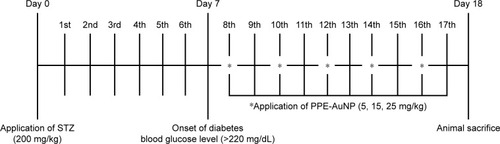
Table 1 Characterization of phenolic compounds of PPE using LC-ESI/MS analysis
Figure 2 Representative liquid chromatography ion chromatogram and product ion mass spectra for (A, B) ellagic acid, (C, D) ellagic acid arabinoside, (E, F) ellagic acid glucoside, (G, H) kaempferol 3-(2G-rhamnosylrutinoside), (I, J) methylgalangin, (K, L) punicalin.
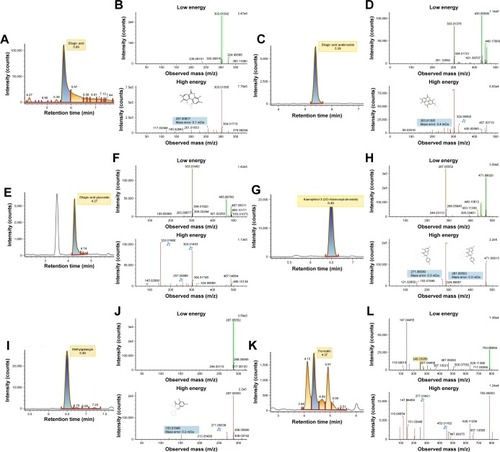
Figure 3 (A) Schematic representation of AuNP synthesis using PPE. (B) Representative photograph showing the color change of PPE-AuNP on room temperature storage (0, 30, and 90 days). (C) UV-visible spectra of PPE-AuNP dispersed in PBS on 0, 30, and 90-day storage. (D–F) Representative AFM micrographs of PPE-AuNP on 0, 30, and 90-day storage. (G, H) Representative TEM image and SAED pattern. (I–K) DLS analysis of PPE-AuNP (0, 30, and 90-day storage). (L) XRD pattern of PPE-AuNP. (M) FTIR spectra for PPE-AuNP and PPE alone.
Abbreviations: AFM, atomic force microscopy; AuNP, gold nanoparticle; FTIR, Fourier transform infrared; PPE, pomegranate peel extract; SAED, selected area of electron diffraction; TEM, transmission electron microscopy; UV, ultraviolet; XRD, X-ray diffraction.
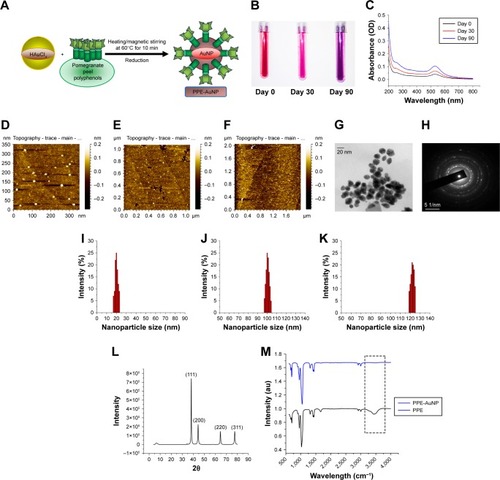
Figure 4 Representative bar graph showing (A) body weight changes, (B) kidney index, (C) level of fasting blood glucose, (D) level of fasting blood glucose upon the treatment of STZ along with PPE alone (5, 15, 25, and 100 mg/kg), (E, F) plasma insulin concentration upon the treatment of STZ along with/without of PPE alone and PPE-AuNP, (G) HOMA-β scoring, level of (H) serum urea, (I) serum creatinine, (J) %Hb1AC, level of (K) total cholesterol, and (L) triglyceride. Values are represented as mean ± SEM (n=6). P<0.05 was considered as significant. Statistical comparison: *Control vs STZ; **STZ vs STZ + PPE-AuNP (5 mg/kg); ***STZ vs STZ + PPE-AuNP (15 mg/kg); #STZ vs STZ + PPE-AuNP (25 mg/kg); NS refers to nonsignificant for STZ along with PPE-AuNP treatment. For STZ and PPE alone treatment, **control vs STZ; ***STZ vs STZ + PPE (25 mg/kg); #STZ vs STZ + PPE (100 mg/kg).
Abbreviations: AuNP, gold nanoparticle; HOMA, homeostatic model assessment; NS, nonsignificant; PPE, pomegranate peel extract; SEM, standard error of mean; STZ, streptozotocin.
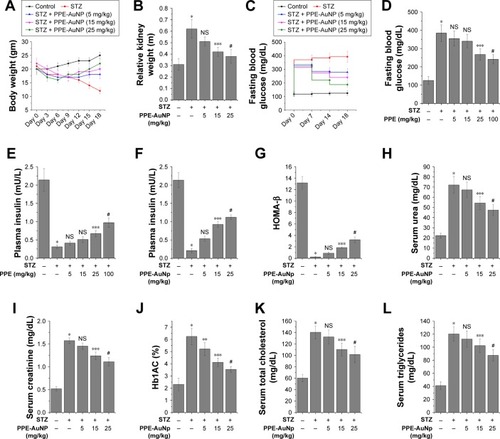
Figure 5 Modulatory role of PPE-AuNP in the alteration of STZ-induced oxidative stress indices. (A) Representative flow cytometric dot plot showing intercellular DCF fluorescence of the isolated renal cells. Cells were isolated from the respective murine kidney tissue after the completion of STZ and PPE-AuNP treatment. (B) Bar graph showing relative DCF fluorescence intensity of renal cells. Representative bar graphs showing (C) LPO, (D) SOD activity, (E) intercellular GSH, and (F) tissue nitrite formation. Values are represented as mean ± SEM (n=6). P<0.05 was considered as significant. Statistical comparison: *Control vs STZ; **STZ vs STZ + PPE-AuNP (5 mg/kg); ***STZ vs STZ + PPE-AuNP (15 mg/kg); #STZ vs STZ + PPE-AuNP (25 mg/kg).
Abbreviations: AuNP, gold nanoparticle; GDH, glutathione; LPO, lipid peroxidation; NS, nonsignificant; PPE, pomegranate peel extract; SEM, standard error of mean; SOD, superoxide dismutase; STZ, streptozotocin.
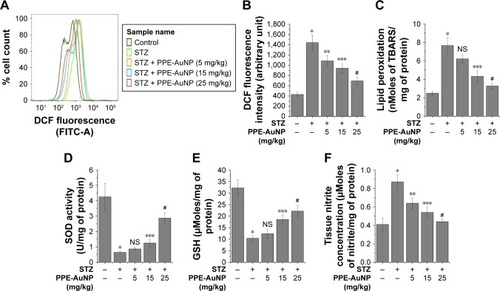
Figure 6 Renal tissue morphological assessment by histopathology using (A) hematoxylin and eosin staining, periodic acid–Schiff staining, Masson’s trichrome staining (magnification: 20×); the arrows highlight morphological change. Representative bar graph showing quantitative analysis of (B) nephritic injury index, (C) glomerular sclerosis score, and (D) tubulointerstitial fibrosis. Values are represented as mean ± SEM (n=6). P<0.05 was considered as significant. Statistical comparison: *Control vs STZ; **STZ vs STZ + PPE-AuNP (5 mg/kg); ***STZ vs STZ + PPE-AuNP (15 mg/kg); #STZ vs STZ + PPE-AuNP (25 mg/kg).
Abbreviations: AuNP, gold nanoparticle; H&E, hematoxylin and eosin; MT, Masson’s trichrome; NS, nonsignificant; PAS, periodic acid-Schiff; PPE, pomegranate peel extract; SEM, standard error of mean; STZ, streptozotocin.
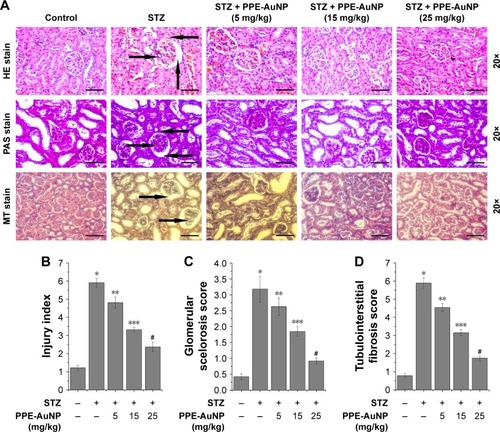
Figure 7 Immunofluorescence images demonstrating the expression of TGF-β and collagen IV. Slides were viewed using a confocal microscope (magnification 20×). Respective fluorescence intensities (TGF-β-FITC, collagen IV-PE, and DAPI) were analyzed using ImageJ software through RGB calculator.
Abbreviations: PE, phycoerythrin; PPE-AuNP, pomegranate peel extract-stabilized gold nanoparticle; RGB, red-green-blue; STZ, streptozotocin; TGF-β, transforming growth factor β.
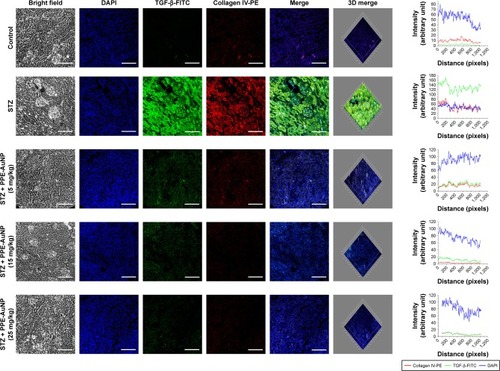
Figure 8 Representative flow cytometric histogram showing (A) AGE, (C) RAGE, (E) NOX-4, and (G) p-p47Phox expression.
Notes: (B–H) Bar graph showing relative fluorescence intensities of AGE-FITC, RAGE-AF647, NOX4-AF647, and p-p47Phox-AF647, respectively. Values are represented as mean ± SEM (n=6). P<0.05 was considered as significant. Statistical comparison: *Control vs STZ; **STZ vs STZ + PPE-AuNP (5 mg/kg); ***STZ vs STZ + PPE-AuNP (15 mg/kg); #STZ vs STZ + PPE-AuNP (25 mg/kg).
Abbreviations: AGE, advanced glycated end product; AuNP, gold nanoparticle; NS, nonsignificant; PPE, pomegranate peel extract; RAGE, receptor for advanced glycated end product; SEM, standard error of mean; STZ, streptozotocin.
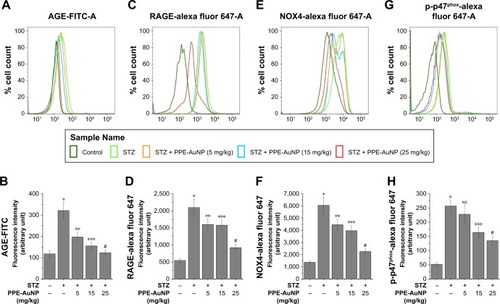
Figure 9 Modulatory role of PPE-AuNP on STZ-induced MAPK-guided NF-κB/STAT3 pathway activation in renal tissue. (A, C, E) Representative immunoblots of p-Raf1, total Raf1, p-ERK1/2, total ERK1/2, p-TAK1, total TAK1, p-p38, total p38, p-IKKα/β, total IKKα/β, p-IκBα, total IκBα, p-p65, total p65, p-p50, total p50, p-STAT3, and total STAT3. (B, D, F) Densitometric analysis of relative protein expression of p-Raf1, total Raf1, p-ERK1/2, total ERK1/2, p-TAK1, total TAK1, p-p38, total p38, p-IKKα/β, total IKKα/β, p-IκBα, total IκBα, p-p65, total p65, p-p50, total p50, p-STAT3, and total STAT3. β-Actin was served as internal control. Values are presented as mean ± SEM (n=6). P<0.05 was considered as significant. Statistical comparison: *Control vs STZ; **STZ vs STZ + PPE-AuNP (5 mg/kg); ***STZ vs STZ + PPE-AuNP (15 mg/kg); #STZ vs STZ + PPE-AuNP (25 mg/kg).
Abbreviations: AuNP, gold nanoparticle; NS, nonsignificant; PPE, pomegranate peel extract; SEM, standard error of mean; STZ, streptozotocin.
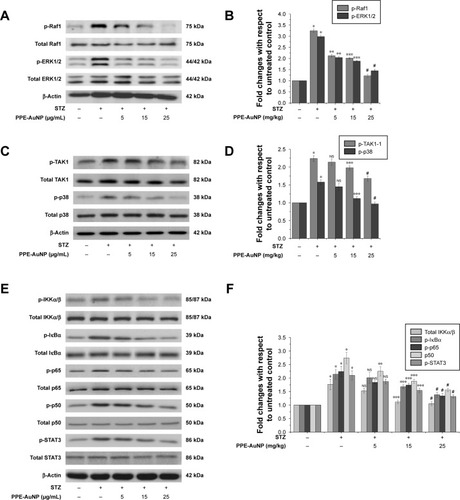
Figure 10 Immunofluorescence images demonstrating the expression of Nrf2 and NF-κB (p65). Slides were viewed using a confocal microscope (magnification 20×). Respective fluorescence intensities (Nrf2-FITC, p65-PE, and DAPI) were analyzed using ImageJ software through RGB calculator.
Abbreviations: PE, phycoerythrin; RGB, red-green-blue.
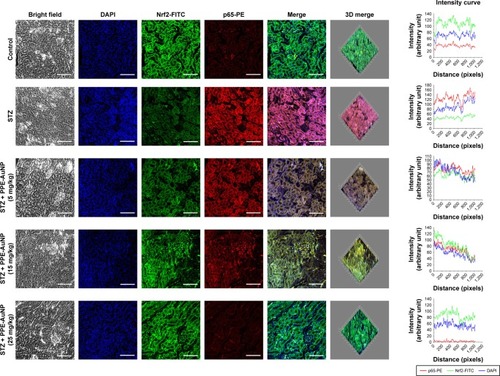
Table 2 The level of cytokines in the serum measured after the completion of experimentation using ELISA
Figure 11 Immunofluorescence images demonstrating the expression of Mn-SOD and COX2. Slides were viewed using a confocal microscope (magnification 20×). Respective fluorescence intensities (Mn-SOD-FITC, COX2-APC, and DAPI) were analyzed using ImageJ software through RGB calculator.
Abbreviations: APC, allophycocyanin; RGB, red-green-blue; SOD, superoxide dismutase.
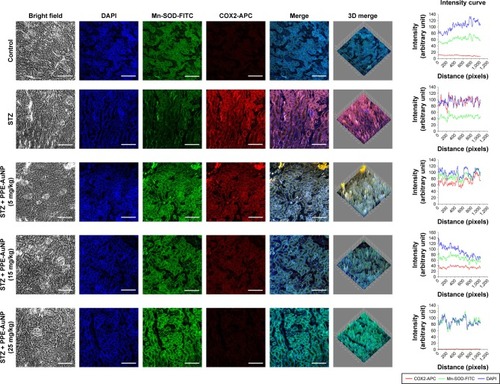
Figure 12 Representative flow cytometric histogram showing (A) p-PI3K, (C) p-AKT, (E) Keap1 and (G) p-Nrf2 expression. (B, D, F, H) Bar graph showing relative fluorescence intensities of p-PI3K-FITC, p-AKT-FITC, Keap1-FITC, and p-Nrf2-FITC, respectively. Values are represented as mean ± SEM (n=6). P<0.05 was considered as significant. Statistical comparison: *Control vs STZ; **STZ vs STZ + PPE-AuNP (5 mg/kg); ***STZ vs STZ + PPE-AuNP (15 mg/kg); #STZ vs STZ + PPE-AuNP (25 mg/kg).
Abbreviations: AuNP, gold nanoparticle; NS, nonsignificant; PPE, pomegranate peel extract; SEM, standard error of mean; STZ, streptozotocin.
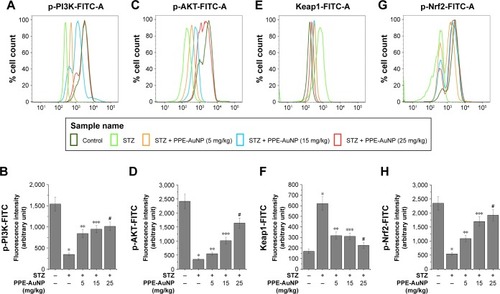
Figure 13 The concentration of AuNP in (A) plasma, (B) renal tissue, (C) hepatic tissue, (D) splenic tissue, (E) cardiac tissue, and (F) lung tissue after the single application of PPE-AuNP in 0 day and 10th day. Values are represented as mean ± SEM (n=6).
Abbreviations: AuNP, gold nanoparticle; PPE, pomegranate peel extract; SEM, standard error of mean.
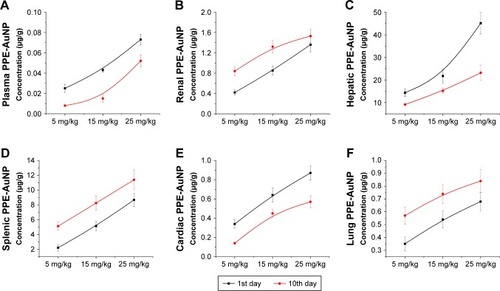
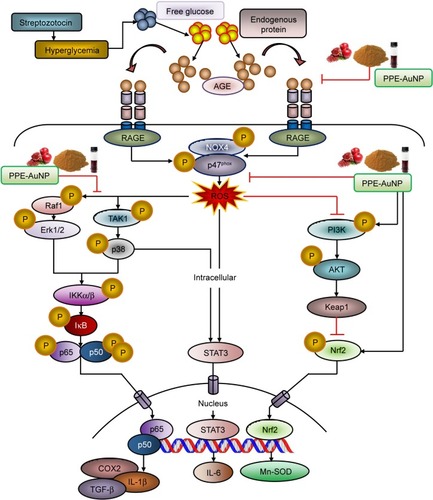
Figure 14 Graphical representation illustrating the probable mechanism of action of PPE-AuNP in ameliorating STZ-induced diabetic nephropathy.
Abbreviations: AuNP, gold nanoparticle; PPE, pomegranate peel extract; STZ, streptozotocin.