Figures & data
Figure 1 The culture and the dual-labeling of MSCs. A) At passage 2, MSCs appeared uniformly spindle-shaped (×100). B) Cells became compact and uniformly aligned in bundles at day 14 (×100). C) Prussian blue-stained cells contained cytoplasmic blue particles and SPIO-labeling efficiency was almost 100% (×100). D) DiD-labeled cells appear red under fluorescence microscopy (×100; excitation wavelength 595–800 nm, emission 660–680 nm). E) Cell proliferation viability was measured by MTT assay for dual-labeled and unlabeled cells
Note: *P > 0.05.
Abbreviations: MSCs, mesenchymal stem cells; SPIO, superparamagnetic iron oxide nanoparticle; DiD, 1,1′-dioctadecyl-3,3,3′,3′-tetramethylindodicarbocyanine, 4-chlorobenzenesulfonate salt; MTT, methyl thiazolyl tetrazolium.
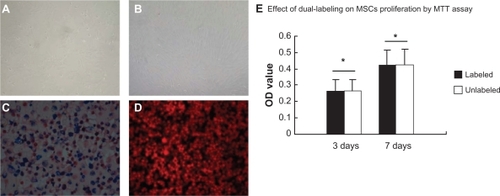
Figure 2 In vitro correlations between MR T2 relaxometry or NIR fluorescent signal and the number of cells. A) A phantom of 2 × 10⁵ cells appeared black, whereas a phantom of 0.125 × 10⁵ cells appeared gray in the MR images. B) A strong correlation between the number of cells and T2 relaxometry was observed (R2 = 0.9547). C) Fluorescent images showed that signal intensity increased with the increasing cell number. Bars represent maximum radiance. D) Correlation plot showed fluorescence counts correlated linearly with cell number (y = −0.002 + 0.02 x; R2 = 0.9976).
Abbreviations: MR, magnetic resonance; NIR, near-infrared.
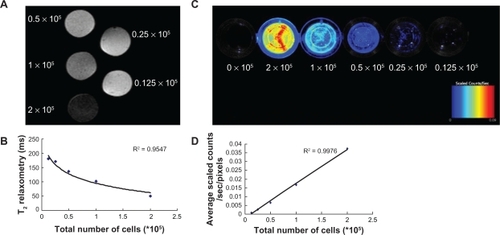
Table 1 ECHO parameters of LV cardiac function and infarct size among three groups 7 days after cell delivery
Figure 3 Measurements of cardiac function and infarct size. A) Representative M-mode images at the level of papillary muscles were recorded among three groups. B) Representative Masson’s trichrome-stained histological sections to measure infarct size. Collagen presented blue but myocardium appeared red. Infarct size was quantified as the area occupied by collagen (blue; yellow hash marks).
Abbreviations: C, control group; IV, intravenous group; IM, intramyocardial group.
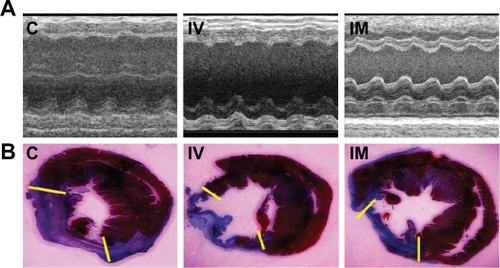
Figure 4 The in vivo NIR fluorescent signal and MR detections. No fluorescent signals were observed in the heart areas of control and IV groups at two time points, but the signals in IM groups lasted over 1 week. MR imaging showed that SPIO-labeled cells were visualized in the infarcted myocardium as hypointense areas by serial MRI studies from day 1 to day 7 in the IM group, but no signals were found in the IV group. A) One day after cell delivery. B) Seven days after cell delivery.
Abbreviations: NIR, near-infrared; MR, magnetic resonance; SPIO, superparamagnetic iron oxide; C, control group; IV, intravenous group; IM, intramyocardial group.
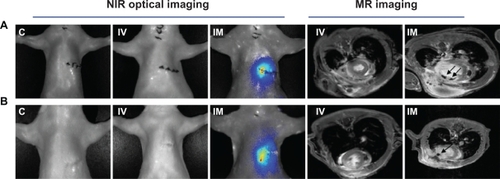
Figure 5 Ex vivo optical imaging study. A–B) Representative NIR fluorescent images in explanted organs 1 or 7 days after labeled MSCs were implanted into rats by means of intravenous or intramyocardial delivery 1 day after coronary artery ligation. C) Quantitative analysis of NIR fluorescent signals in explanted hearts and lungs among the two cell transplanted groups, indicating that cell delivery by direct IM injection resulted in a 3–10-fold higher fluorescent signal than IV infusion in explanted hearts from day 1 to day 7. In contrast, compared with the IM group, NIR fluorescent signals exist in lungs from the IV group during 1 week post cell delivery. (A: One day after cell delivery. B: Seven days after cell delivery).
Abbreviations: NIR, near-infrared; H, heart; L, lung; C, control group; IV, intravenous group; IM, intramyocardial group.
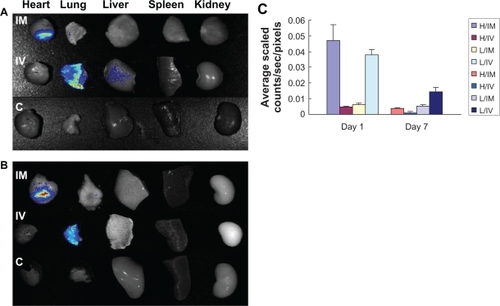
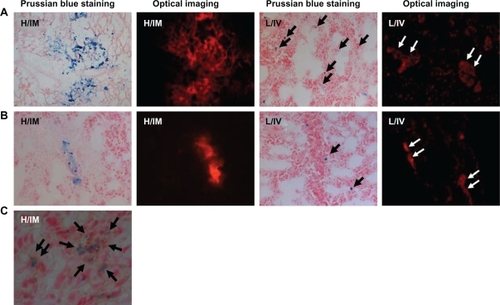
Figure 6 Cryosections of the myocardium and the lung were detected by Prussian blue staining, fluorescence microscopy, and immunohistochemical staining. A–B) SPIO blue particles and NIR fluorescent signals were observed in the myocardium of the IM group at two time points. However, in the IV group, SPIO particles and fluorescent signals were found only in the lungs. Interestingly, a mass of transplanted cells were located in pulmonary interstitium. (×100; A: One day after cell delivery, B: Seven days after cell delivery). C) Section from infarcted myocardium in the IM group at day 7 was determined by Prussian blue and ED-1 immunohistochemical costaining. The distribution of blue particles was consistent with ED-1staining, indicating that most implanted stem cells were phagocytosed by macrophages (×400).
Abbreviations: SPIO, superparamagnetic iron oxide; NIR, near-infrared; H, heart; L, lung; IV, intravenous group; IM, intramyocardial group.