Figures & data
Table 1 Experimental runs designed by D-optimal model, using qualitative (phospholipid-polyethylene glycol [Pl-PEG] type) and quantitative variables (single-walled carbon nanotube [SWCNT] aqueous concentration and loading efficiency) on the basis of two responses
Table 2 Independent variables, variable types, and their constraints used for D-optimal design and optimization of functionalization process of single-walled carbon nanotubes (SWCNTs)
Figure 1 Ultraviolet-visible spectra of A) pure single-walled carbon nanotubes (SWCNTs), B) phospholipid-polyethylene glycol 5000-SWCNTs, and C) P7-SWCNTs.
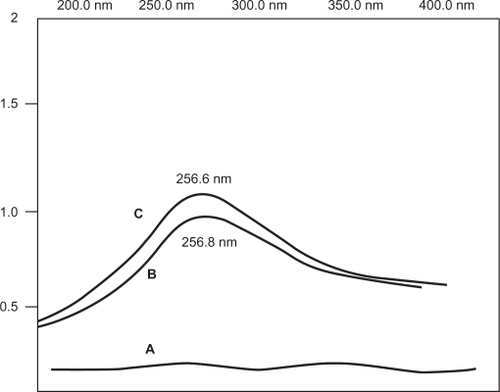
Figure 2 Ultraviolet-visible calibration curve constructed with various concentrations of P7-single-walled carbon nanotubes (SWCNTs) and used for the determination of the aqueous solubility of phospholipid-polyethylene glycol-functionalized SWCNTs.
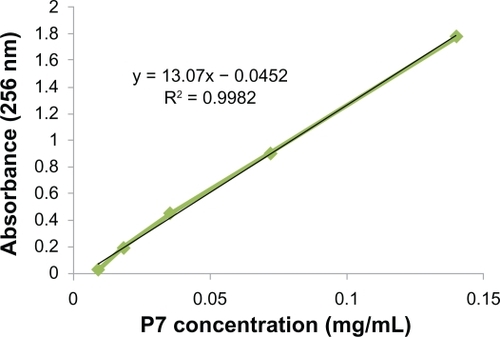
Figure 3 Ultraviolet calibration curve generated with known concentrations of both amine-containing compounds and used for the measurement of free amine content.
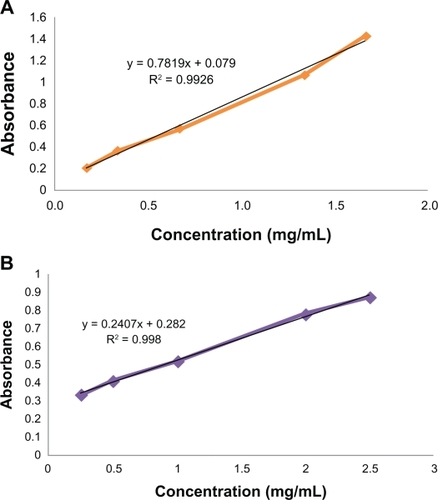
Figure 4 Contour plots of single-walled carbon nanotubes (SWCNTs) functionalized with phospholipid-polyethylene glycol (PI-PEG) 2000-NH2 for A) aqueous concentration and B) loading efficiency.
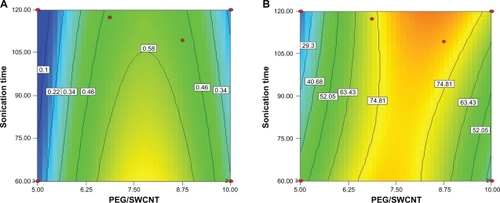
Figure 5 Contour plots of single-walled carbon nanotubes (SWCNTs) functionalized with phospholipid-polyethylene glycol (PI-PEG) 5000-NH2 for A) aqueous concentration and B) loading efficiency.
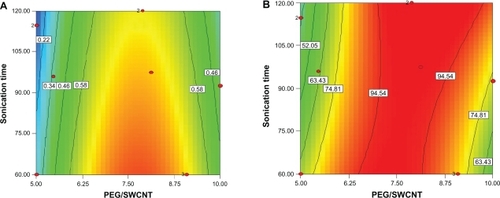
Figure 6 Raman spectra of A) pure single-walled carbon nanotubes (SWCNTs), B) phospholipid-polyethylene glycol (Pl-PEG) 5000-SWCNTs, and C) Pl-PEG 2000-SWCNTs.

Table 3 Optimum solutions and the corresponding responses proposed on the basis of optimum responsesTable Footnotea
Figure 7 Contour plot of optimized samples constructed with phospholipid-polyethylene glycol (Pl-PEG) 5000-NH2, displaying optimum results for both responses, simultaneously.
Abbreviation: SWCNT, single-walled carbon nanotube.
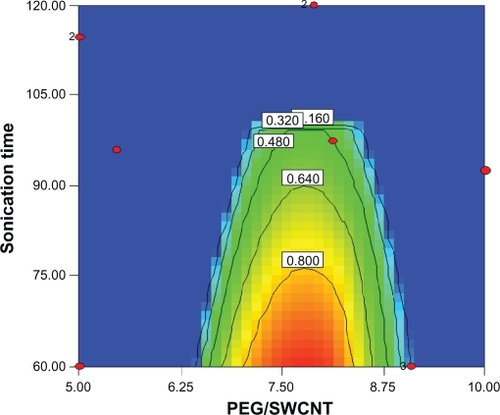
Figure 8 Thermogravimetric analysis (TGA) graphs of A) nonfunctionalized pure single-walled carbon nanotubes (SWCNTs) and B) phospholipid-polyethylene glycol 5000-SWCNTs.
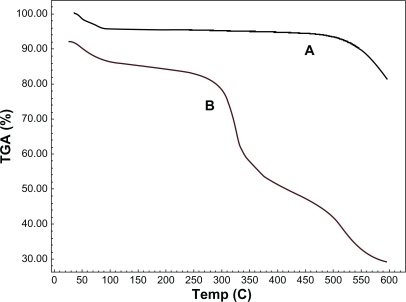
Table 4 Validation of optimization process
Figure 9 Scanning electron microscopy images of A) nonfunctionalized pure single-walled carbon nanotubes (SWCNTs) and B) phospholipid-polyethylene glycol 5000-SWCNTs.
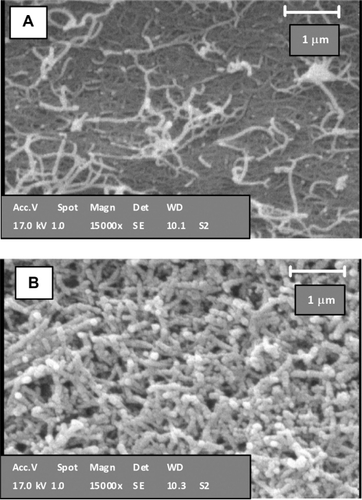
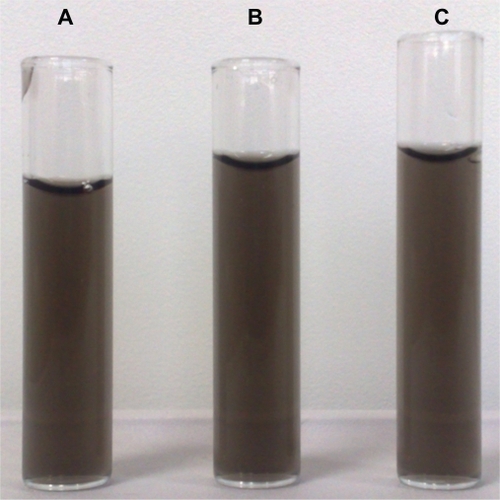
Figure 10 Homogenous dispersion of functionalized single-walled carbon nanotubes (sample from , run 14) A) at the time of preparation, B) after storage for 1 month, and C) after storage for 2 months.