Figures & data
Figure 1 A) Chemical structure of ethylenedicysteine deoxyglucose. B) General procedure for synthesis of (a) DTPA-DA and (b) DTPA-DG.
Abbreviations: DTPA, diethylenetriamine penta-acetic acid-D-glucosamine; DTPA-DG, diethylenetriamine penta-acetic acid-D-deoxy-glucosamine.
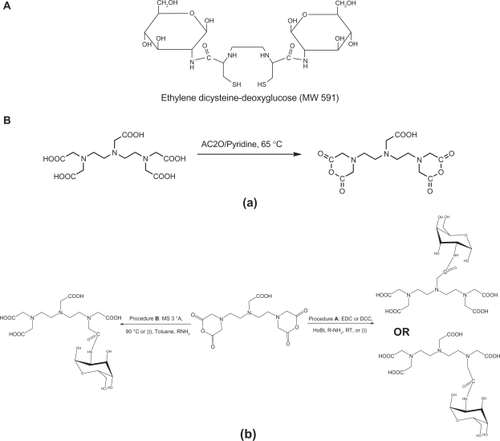
Figure 2 Schematic illustration of performance of in vitro T1/T2 measurements using magnetic resonance imaging apparatus. For each concentration, triplicate sampling and the maximum region of interest were considered. Five concentrations of Gd3+-DTPA-DG (0.33, 0.17, 0.08, 0.04, and 0.02 mmol/mL) were obtained by dilution with sodium chloride 0.9%.
Abbreviation: Gd3+-DTPA-DG, gadopentetate dimeglumine-D-deoxy-glucosamine.
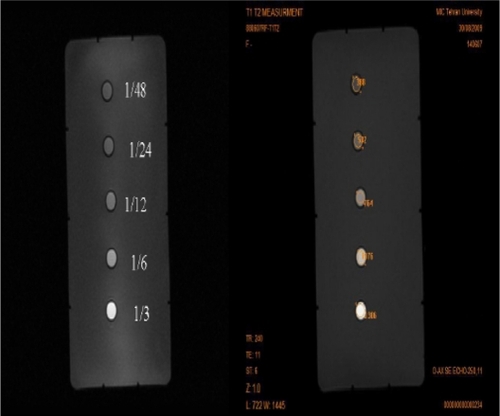
Figure 3A MTT results of 48 hours of Gd3+-DTPA-DG exposure to HT1080 and HT29 cell lines. The average percent of viable cells is also shown.
Abbreviation: Gd3+-DTPA-DG, gadopentetate dimeglumine-D-deoxy-glucosamine.
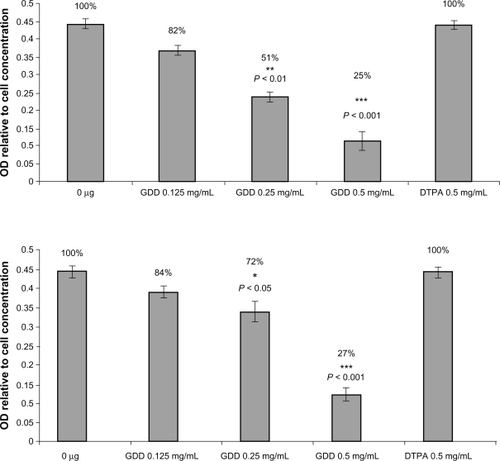
Figure 3B MTT results of 48 hours of Gd3+-DTPA-DG exposure to HKC-5 and HEK-293 human kidney cell lines. No significant toxic effect was observed.
Abbreviation: Gd3+-DTPA-DG, gadopentetate dimeglumine-D-deoxy-glucosamine.
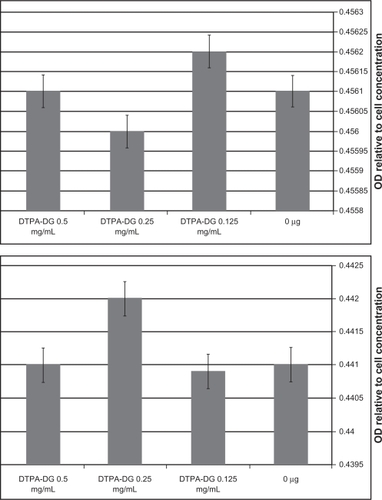
Figure 4 Effect of Gd3+-DTPA-DG and DTPA on TNF-α release. As depicted, the complex increased TNF-α release significantly.
Abbreviations: DTPA, diethylenetriamine penta-acetic acid; Gd3+-DTPA-DG, gadopentetate dimeglumine-D-deoxy-glucosamine.
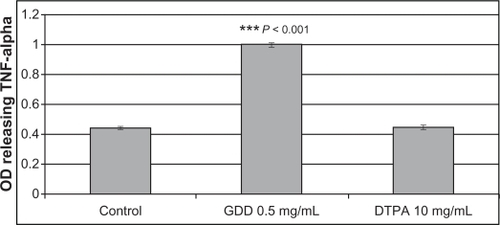
Figure 5 Effect of DTPA-DG on blood glucose level in rats. No significant changes were observed.
Abbreviation: DTPA-DG, diethylenetriamine penta-acetic acid-D-deoxy-glucosamine.
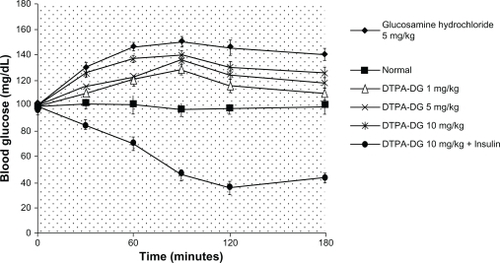
Table 1A Positive hexokinase enzyme response to Gd3+-DTPA-DG, glucose, and glucosamine
Figure 6 Effects of the experimental complex on coagulation factors. No significant changes were observed in PT and APTT factors.
Abbreviations: PT, prothrombin time; APTT, activated partial thromboplastin time.
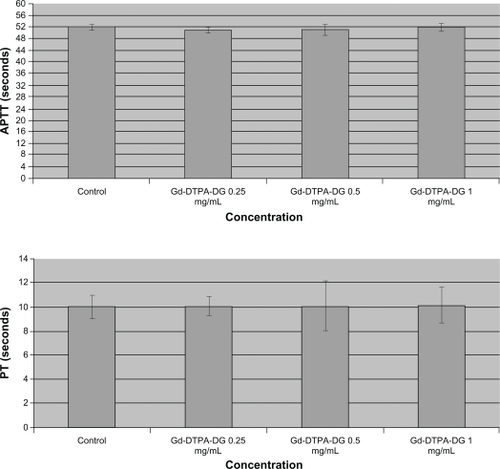
Figure 7 Morphological changes in HT1080 cells. A) Control group without any treatment, B) 0.125 mg/mL Gd3+-DTPA-DG, and C) 0.5 mg/mL Gd3+-DTPA-DG. The amount of HT1080 cancer cells was observed to diminish significantly only in the Gd3+-DTPA-DG group.
Abbreviation: Gd3+-DTPA-DG, gadopentetate dimeglumine-D-deoxy-glucosamine.
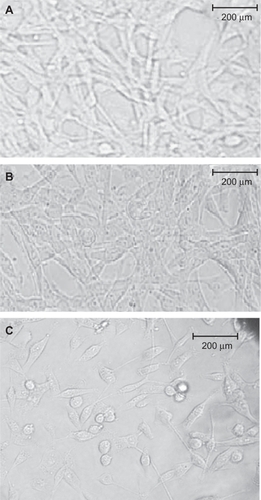
Table 1B T1 values (msec) derived from Equationequations 1(1) and Equation2
(2)
Table 1C T2 values (msec) derived from Equationequations 1(1) and Equation2
(2)
Table 1D The average corresponding Magnevist® T1 values as comparison standard
Table 1E Mean Gd3+-DTPA-DG T1 values (msec) from stability testing. Each sample was repeated at least three times
Table 2 Mean in vivo T1, T2 data for Gd3+-DTPA-DG and Magnevist® relaxation times at different time points and tissues are shown as the mean ± standard error of the mean for tumor-bearing nude mice (mean weight 18 ± 1.3 g, n = 3 in each group)
Figure 8A T2 data based on spin echo and gradient echo protocols.
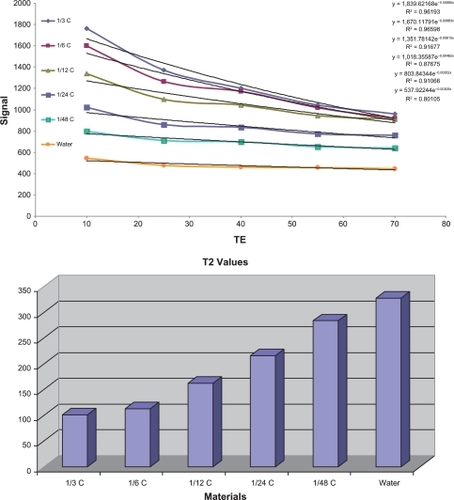
Figure 8B T1 data based on spin echo and gradient echo protocols.
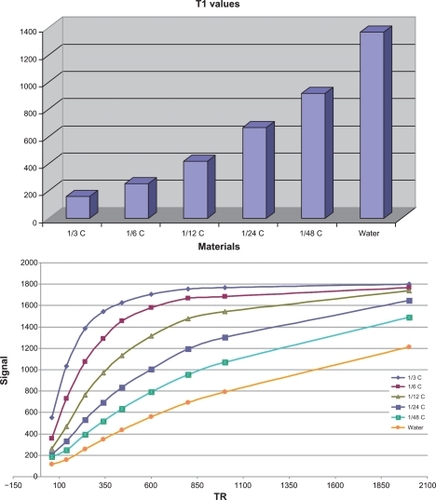
Figure 9A Magnetic resonance images (T1 weighted method) prior and 20 minutes after Gd3+-DTPA-DG intravenous injection (A and B) in mice bearing human lung cancer (each image was performed on three mice). The tumor site was definitely enhanced. Magnetic resonance images (T1 weighted method) 20 minutes post Gd3+-DTPA + Gd3+-DTPA-DG (C) and Gd3+-DTPA (Magnevist®, D) intravenous injection in mice bearing human lung cancer.
Abbreviations: Gd3+-DTPA-DG, gadopentetate dimeglumine-D-deoxy-glucosamine; Gd3+-DTPA, gadopentetate dimeglumine.
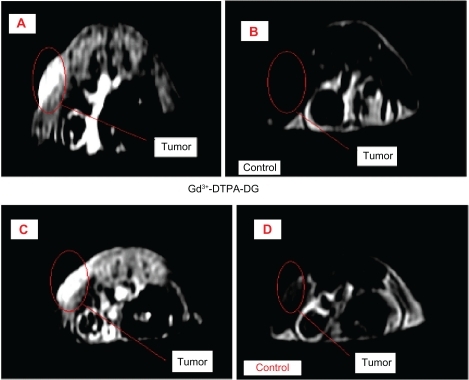
Figure 9B Illustration of the whole body magnetic resonance images prior and 20 minutes post intravenous Gd3+-DTPA-DG injection in mice bearing human lung cancer cells.
Abbreviation: Gd3+-DTPA-DG, gadopentetate dimeglumine-D-deoxy-glucosamine.
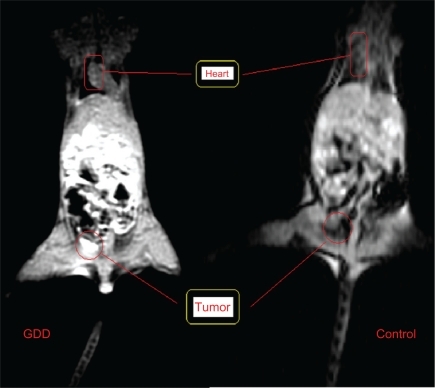
Figure 10 Illustration of the ability of Gd3+-DTPA-DG to penetrate the blood-brain barrier. The nude mice brain was significantly enhanced 20 min post intravenous Gd3+-DTPA-DG injection. As observed, Magnevist® could not enhance the animal brain resolution. Gd3+-DTPA-DG seems to show the same pharmacokinetics as 18FDG in the brain as well as in the gastrointestinal tract and tumor sites.
Abbreviation: Gd3+-DTPA-DG, gadopentetate dimeglumine-D-deoxy-glucosamine.

Figure S1 Illustration of the original U.V spectrums of DTPA (A), D-Glucosamine (B), DTPA-DG (C), and Gd3+-DTPA-DG (D).

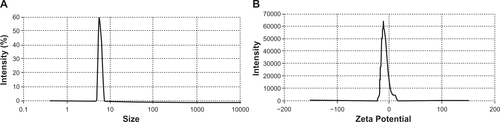
Figure S2 Size and zeta potential distribution. A) size and B) zeta potential distribution of the DTPA-DG compound according to concentration.