Figures & data
Figure 1 Overview of the study.
Notes: (A) Preparation of GPC1-targeted NCs (ORI-GPC1-NPs). (B) ORI-GPC1-NPs are multifunctional theranostic nanoplatforms used for NIRF/MR imaging and targeted therapy. The anti-GPC1 antibody, BSA, Cy7-NHS ester, and Gd-DOTA-NHS ester were covalently grafted onto AuNCs based on an esterification reaction between the amino group and carboxyl group.
Abbreviations: AuNCs, gold nanocages; BSA, bovine serum albumin; Gd, gadolinium; HA-SH, thiolated hyaluronic acid; MR, magnetic resonance; NIRF, near-infrared fluorescence; ORI, oridonin; ORI-NPs, Gd-ORI@HAuNCs-Cy7 nanoparticles; ORI-GPC1-NPs, GPC1-Gd-ORI@HAuNCs-Cy7 nanoparticles.
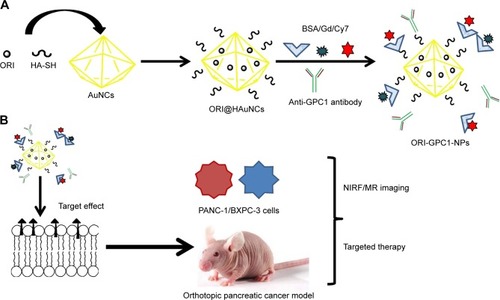
Figure 2 Characterization of nanoparticles.
Notes: (A) TEM images of AuNCs and ORI-GPC1-NPs. (B) The UV absorbance curve of AuNCs, anti-GPC1antibody, DOTA, and supernatant. (C) Hydrodynamic size of ORI-NPs and ORI-GPC1-NPs. (D) DLS size distribution in different time of ORI-GPC1-NPs. (E) Photograph of ORI-GPC1-NPs at different pHs. (F) EDS spectrum. (G) FTIR spectra of AuNCs, ORI@HAuNCs, and GPC1-ORI-NPs. (H) ORI loading. (I) Release profile of ORI from ORI-GPC1-NPs in 10% FBS containing media. (J) Fluorescence imaging of ORI-GPC1-NPs in vitro. (K) T1-weighted MR imaging of ORI-GPC1-NPs in vitro.
Abbreviations: AuNCs, gold nanocages; DLS, dynamic light scattering; EDS, energy disperse spectroscopy; FBS, fetal bovine serum; FTIR, Fourier transform infrared; Gd, gadolinium; MR, magnetic resonance; ORI, oridonin; ORI-NPs, Gd-ORI@HAuNCs-Cy7 nanoparticles; ORI-GPC1-NPs, GPC1-Gd-ORI@HAuNCs-Cy7 nanoparticles; TEM, transmission electron microscope; UV, ultraviolet.
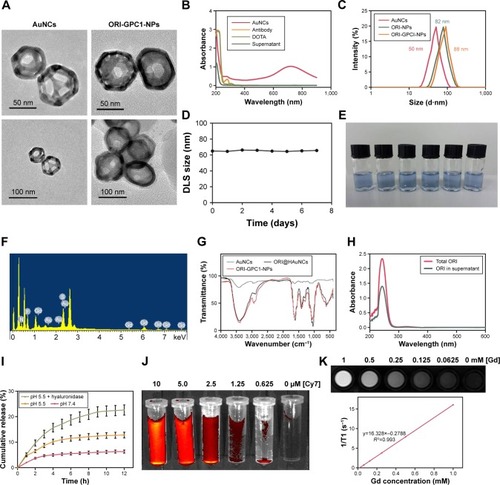
Figure 3 Expression of GPC1.
Notes: (A) PCR analyses of GPC1 mRNA expressions in 293T, PANC-1, BXPC-3, and SW1990 cells. (B) Flow cytometry results for GPC1 expression in 293T, PANC-1, BXPC-3, and SW1990 cells. *P<0.05, for vs 293T. Data are presented as mean ± SD.
Abbreviation: GPC1, glypican-1.

Figure 4 (A) The distribution of ORI-GPC1-NPs in PANC-1, BXPC-3, and 293 T cells examined by bio-TEM under 2 μm and 200 nm scale bars; (B) Cell viability of PANC-1, BXPC-3, and 293 T cells treated by ORI, ORI-NPs, and ORI-GPC1-NPs after 24 and 48 hours.
Notes: Red arrows indicate internalized ORI-GPC1-NPs. Cell viability was calculated by the percentage of living cells. *P<0.05, for ORI-NPs, ORI-GPC1-NPs vs ORI, #P<0.05, for ORI-NPs vs ORI-GPC1-NPs.
Abbreviations: ORI, oridonin; ORI-NPs, Gd-ORI@HAuNCs-Cy7 nanoparticles; ORI-GPC1-NPs, GPC1-Gd-ORI@HAuNCs-Cy7 nanoparticles.
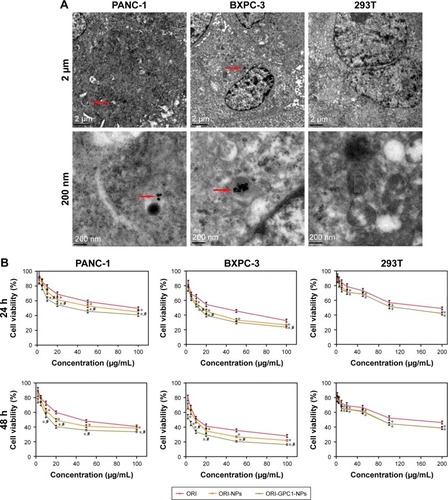
Table 1 IC50 of cells with different treatments by MTT viability assays
Figure 5 (A) Apoptosis assays for PANC-1 and BXPC-3 cells after different treatments. (B) Western blot assay for the expression of apoptosis-related proteins (Bcl-2 and cleaved-caspase-3) after different treatments. (C) Cell cycle analysis and (D) cell cycle rate in PANC-1 and BXPC-3 cells after different treatments. (E) Transwell migration assay and (F) number of invasion cells for PANC-1 and BXPC-3 cells after different treatments.
Note: *P<0.05, for vs NC, #For vs ORI-NPs.
Abbreviations: Cleaved-Casp3, cleaved-caspase-3; ORI, oridonin; ORI-NPs, Gd-ORI@HAuNCs-Cy7 nanoparticles; ORI-GPC1-NPs, GPC1-Gd-ORI@HAuNCs-Cy7 nanoparticles.
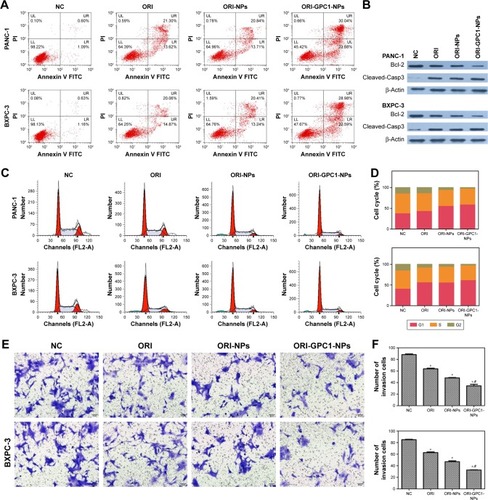
Figure 6 In vivo NIRF/MRI and ICP-MS.
Notes: (A) In vivo NIRF images and (B) their fluorescent intensity of tumor-bearing nude mice at specified times after injection of ORI-NPs or ORI-GPC1-NPs. (C) Ex vivo NIRF images (Organs: 1. Tumor, 2. Liver, 3. Kidneys, 4. Spleen, 5. Stomach, 6. Intestine, 7. Heart, 8. Lung) and (D) fluorescent intensity of tumor and major organs at 48 hours after injection of ORI-NPs and ORI-GPC1-NPs. Organs: tumor, liver, kidneys, spleen, stomach, intestines, heart, and lung. (E) In vivo MR images and (F) MRI intensity of tumor- bearing nude mice at specified times after injection of ORI-NPs or ORI-GPC1-NPs. Au and Gd concentrations in tumors and major organs were measured by ICP-MS at (G) 12 hours, (H) 24 hours, and (I) 48 hours. *P<0.05, for ORI-NPs vs ORI-GPC1-NPs.
Abbreviations: Au, gold; Gd, gadolinium; ICP-MS, inductively coupled plasma mass spectrometry; MR, magnetic resonance; MRI, magnetic resonance imaging; NIRF, near- infrared fluorescence; ORI-NPs, Gd-ORI@HAuNCs-Cy7 nanoparticles; ORI-GPC1-NPs, GPC1-Gd-ORI@HAuNCs-Cy7 nanoparticles.
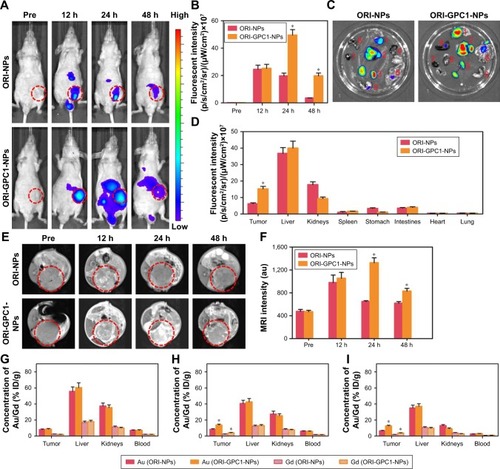
Figure 7 In vivo antitumor efficiency.
Notes: (A) Body weight of BXPC-3 tumor-bearing nude mice after different treatments. (B) The tumor volume of tumor-bearing nude mice after different treatments. (C) Tumor weight after different treatments. (D) Photographs of the tumor from different treatment groups after 14 days. (E) IHC assays for Bcl-2 and cleaved-Casp3 expression, (F) the relative expression of Bcl-2 and (G) caspase-3 relative expression. *P<0.05, for vs all the other treatments.
Abbreviations: Cleaved-Casp3, cleaved-caspase-3; GEM, gemcitabine; IHC, immunohistochemistry; NC, negative control; ORI, oridonin; ORI-NPs, Gd-ORI@HAuNCs- Cy7 nanoparticles; ORI-GPC1-NPs, GPC1-Gd-ORI@HAuNCs-Cy7 nanoparticles.
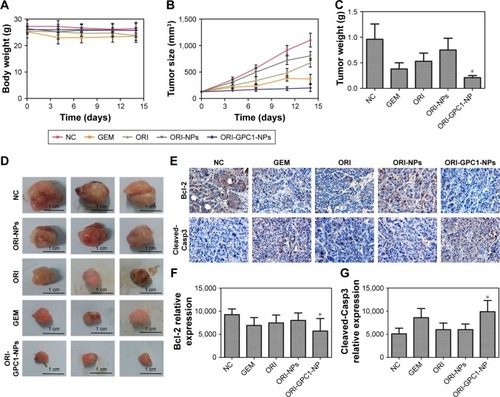
Figure S1 The zeta potential of nanoparticles.
Notes: (A) AuNCs, (B) ORI-NPs, and (C) ORI-GPC1-NPs.
Abbreviations: AuNCs, gold nanocages; ORI-NPs, Gd-ORI@HAuNCs-Cy7 nanoparticles; ORI-GPC1-NPs, GPC1-Gd-ORI@HAuNCs-Cy7 nanoparticles.
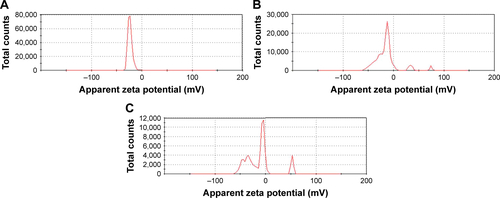
Figure S2 In vivo toxicology assays.
Notes: (A) Weight of nude mice from different dose of ORI-GPC1-NP treatment groups over 21 days. Complete blood markers including (B) RBC, (C) HGB, (D) WBC and LY. (E) Liver function markers: ALP, ALT, and AST. (F) Kidney function markers: BUN and CREA from different dose of ORI-GPC1-NP treatment groups.
Abbreviations: ALP, alanine alkaline phosphatase; ALT, aminotransferase; AST, aspartate aminotransferase; BUN, blood urea nitrogen; CREA, creatinine; HGB, Hemoglobin; LY, lymphocyte; NC, negative control; ORI-GPC1-NPs, GPC1-Gd-ORI@HAuNCs-Cy7 nanoparticles; RBC, red blood cells; WBC, white blood cells.
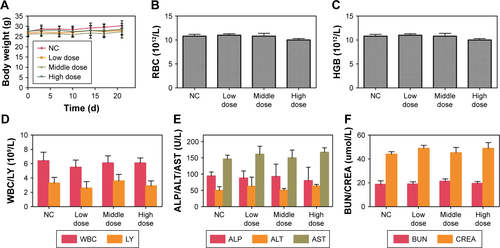
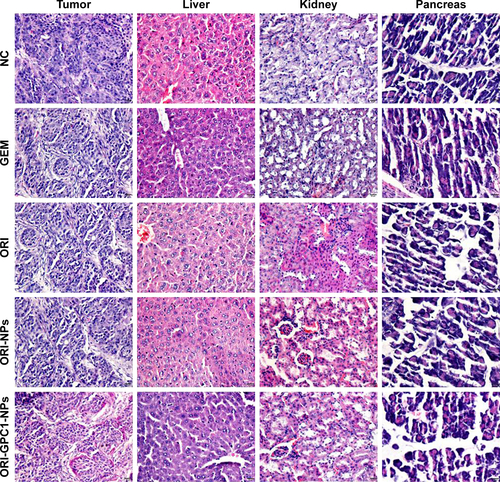
Figure S3 H&E staining of tumor and major organs gathered from control, GEM, ORI, ORI-NP, and ORI-GPC1-NP groups after treatments for 14 days.
Abbreviations: GEM, gemcitabine; NC, negative control; ORI, oridonin; ORI-NPs, Gd-ORI@HAuNCs-Cy7 nanoparticles; ORI-GPC1-NPs, GPC1-Gd-ORI@HAuNCs-Cy7 nanoparticles.