Figures & data
Figure 1 Structure and size of PEG-DSPE Micelles. (A) Schematics of CCR2-targeting and non-targeted but loaded micelles. (B) Hydrodynamic diameter of non-targeted (plain) and (C) CCR2-targeting micelles by dynamic light scattering.
Abbreviation: PEG-DSPE, poly(ethylene glycol)-distearoylphosphatidylethanolamine.
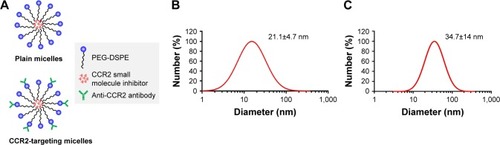
Figure 2 (A) The small molecule CCR2 antagonist inhibits migration of RAW 264.7 cells. (B) The molecular structure of the BMS CCR2 small molecule antagonist with a molecular weight of 593.66 Da.
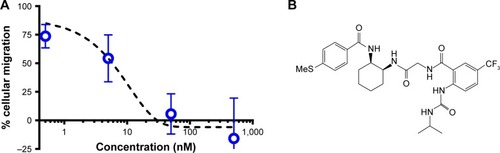
Figure 3 Binding of CCR2-targeting and non-targeted (plain) micelles to RAW 264.7 cells as analyzed by (A) flow cytometry and (B) MFI, and (C, D) fluorescence microscopy with nuclei stained in blue (DAPI) and DiD-labeled CCR2-targeting micelles shown in red. Scale bar =50 μm. Data are presented as mean ± SD, ****P<0.0001 by one-way ANOVA followed by Dunnett’s test. (E) MTT assay of CCR2-targeting and non-targeted (plain) micelles in RAW 264.7 cells.
Abbreviation: MFI, mean fluorescence intensity.
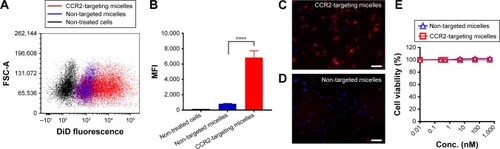
Figure 4 Effect of CCR2-targeting and non-targeted micelles on the number of inflammatory monocytes (Ly6Chigh Mo) in the spleen (A–C) and in the infarcted heart (D–F), n=4–6. Data are presented as mean ± SD, *P<0.05, ***P<0.001 by one-way ANOVA followed by Dunnett’s test compared with PBS-treated mice.
Abbreviation: FITC, fluorescein isothiocyanate.
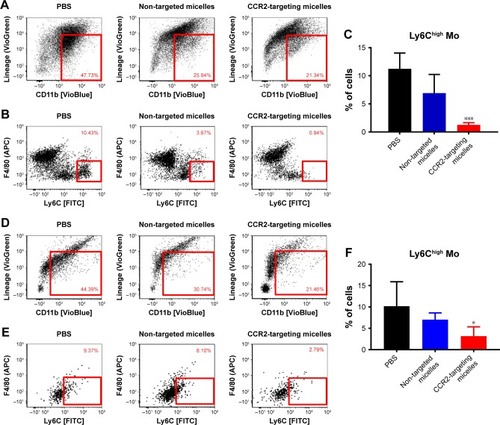
Figure 5 (A) Schematic depicting the timeline of MI induction and treatment with CCR2-targeting and plain micelles containing a CCR2 small molecule antagonist. (B) Infarct area quantified by length, *P<0.05 by one-way ANOVA followed by Dunnett’s test. (C) Infarct area expressed as percentage of LV area and total area. (D) Masson trichrome staining (12 days after MI) of sequential heart sections of mice treated with PBS, non-targeted micelles, and CCR2-targeting micelles. (E) EF % and FS % 12 days post MI of mice treated with PBS (n=6), non-targeted micelles (NT, n=6), and CCR2-targeting micelles (T, n=4). Sham-treated mice served as controls. Data are presented as mean ± SD.
Abbreviations: EF, Ejection fraction; FS, fractional shortening; LV, left ventricular; MI, myocardial infarction.
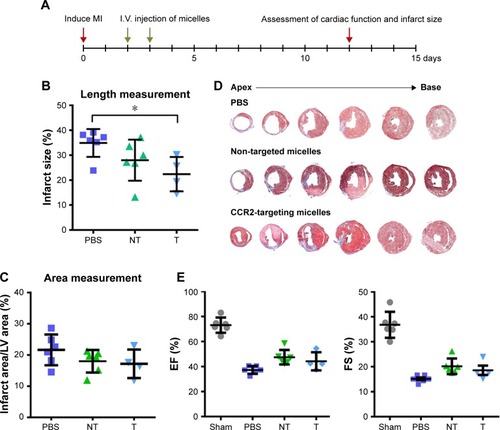
Figure S1 (A) Accumulation of CCR2-targeting and non-targeted micelles in the infarcted heart. (B) Biodistribution of CCR2-targeted and non-targeted micelles in mice with myocardial infarction.
Note: Data are represented as mean ±SD, n=3.
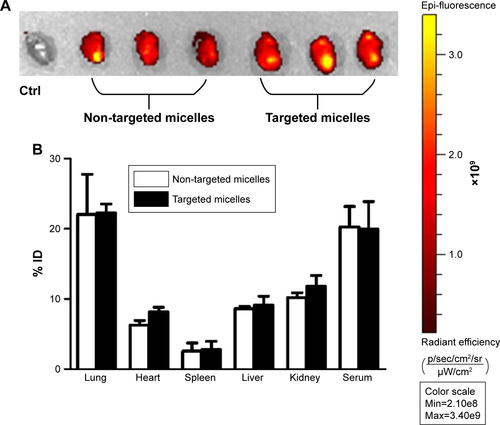
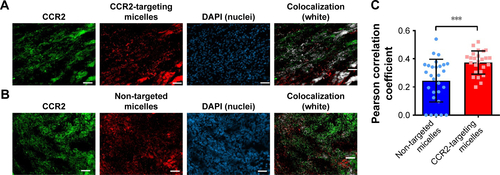
Figure S2 Colocalization studies of DiD-labeled (A) CCR2-targeting micelles and (B) non-targeted micelles with CCR2-labeled inflammatory cells in the infarcted myocardium. The colocalization of CCR2-positive cells and DiD-labeled micelles is shown in white. (C) The PCC was used to quantify the degree of colocalization between CCR2-positive inflammatory cells and the DiD-labeled CCR2-targeting and non-targeted micelles.
Notes: A PCC of 1 indicates perfect correlation, a PCC of 0 means no correlation, and a PCC of −1 means perfect inverse correlation. The CCR2-targeting micelles showed a significantly greater colocalization with CCR2-positive cells than non-targeted micelles (P=0.0004). Three days after inducing myocardial infarction, mice were treated with DiD-labeled CCR2-targeting (n=3) and non-targeted micelles (n=3). 6 hours post administration, the hearts were removed and embedded in Tissue-Tek O.C.T. Frozen heart sections with 10 μm thickness were fixed and permeabilized with ice-cold acetone, and blocked with 5% bovine serum albumin in TBST. The sections were stained with an anti-mouse CCR2 antibody (Thermo Fisher Scientific, PA5-23043) at a 1:50 dilution for 1 hour at room temperature, followed by 45 minutes incubation with a secondary antibody labeled with Alexa Fluor 568 at 1:200 dilution. The nuclei were stained with DAPI. The analysis was performed in ImageJ using the Coloc 2 function. On average, three cryosections per heart were analyzed. For each cryosection, three representative images were taken. Data are presented as mean ± SD. A two-tailed t-test was used to determine statistical significance (P=0.0004). ***P≤0.001.
Abbreviation: PCC, Pearson correlation coefficient.