Figures & data
Figure 1 A flow cytometric histogram of cell fluorescence with quadrant markers, drawn to distinguished viable (nonlabeled) from dead (propidium iodide-labeled) cells. Quadrant B shows viable cells and quadrant D shows dead cells.
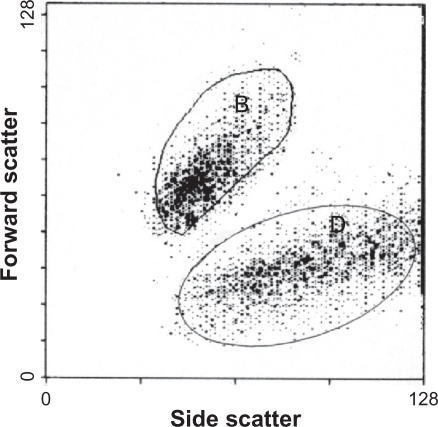
Figure 2 Model structure of quantum dot probes, consisting of CdSe/ZnS quantum dots coated with non-crosslinked PAMAM dendrimers or encapsulated in crosslinked PAMAM dendrimers.
Abbreviations: PAMAM, polyamidoamine; EDC, 1-ethyl-3(3-dimethylamino propyl)-carbodiimide; QD, quantum dot.
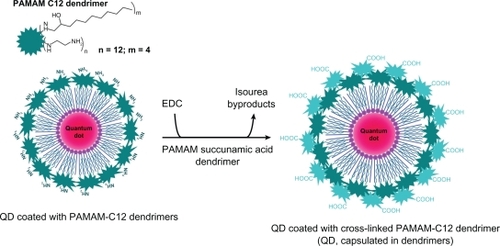
Figure 3 Two-photon excited fluorescent images of brain vasculature in horizontal planes (at 150 μm depth from brain surface) after intravenous injection of QD525 (coated with non-crosslinked PAMAM dendrimers [A] or capsulated in crosslinked dendrimers [B] in the anesthetized rat).
Notes: All images were obtained at λex = 810 nm and a mean laser power of about 2.7 W. Detectors: filter/band-pass 525/50 nm (via 560/10 nm beam splitter).
Abbreviations: PAMAM, polyamidoamine; QD, quantum dot.
![Figure 3 Two-photon excited fluorescent images of brain vasculature in horizontal planes (at 150 μm depth from brain surface) after intravenous injection of QD525 (coated with non-crosslinked PAMAM dendrimers [A] or capsulated in crosslinked dendrimers [B] in the anesthetized rat).Notes: All images were obtained at λex = 810 nm and a mean laser power of about 2.7 W. Detectors: filter/band-pass 525/50 nm (via 560/10 nm beam splitter).Abbreviations: PAMAM, polyamidoamine; QD, quantum dot.](/cms/asset/7c85b828-d6e7-41ff-beda-1d1a7085c955/dijn_a_17995_f0003_b.jpg)
Table 1 Physiological characteristics of rats before and after intravenous injection of QDs (coated with noncrosslinked PAMAM dendrimers)
Table 2 Physiological characteristics of rats before and after intravenous injection of QDs (encapsulated in crosslinked PAMAM dendrimers)
Table 3 Effect of CdSe/ZnS QD485 (coated with noncrosslinked PAMAM dendrimers) on cell viability in vitro (% from control)
Figure 4 (A) Dynamics of tetramethylrhodamine ethyl ester (TMRE) fluorescence of Jurkat cells in the absence (control) or presence of dendrimer-coated QD485 100 nM. (B) Hypothetical mechanism of cytotoxicity of QD, coated with non-crosslinked polyamidoamine dendrimers.
Abbreviations: Apaf-1, apoptotic peptidase-activating factor 1; QD, quantum dot.
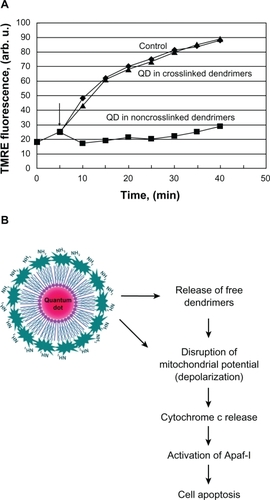
Figure 5 Model structure of QD probe, consisting of silica-shelled QD conjugated with PEG.Citation48
Note: Reprinted with permission from Zhelev Z, Ohba H, Bakalova R. Single quantum dot-micelles coated with silica shell as potentially non-cytotoxic fluorescent cell tracers. J Am Chem Soc. 2006;128:6324–6325. Copyright 2006 American Chemical Society.
Abbreviations: QD, quantum dot; PEG, polyethylene glycol.
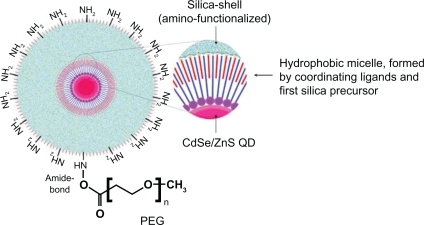
Figure 6 Electron micrographs of nasal mucosa one day after intranasal inoculation of amino-functionalized silica-shelled quantum dots (dissolved in distilled water, 30 drops per animal, single dose).
Abbreviation: QD, quantum dot.
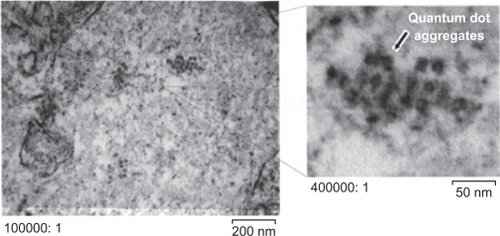
Table 4 Physiological characteristics of rats before and after intravenous injection of PEG1100-grafted silica-shelled QDs
Table 5 Effect of silica-shelled CdSe/ZnS QDs (conjugated with PEG1100) on cell viability in vitro (% from control)
Figure 7 Two-photon excited fluorescent images of brain vasculature in horizontal planes (at 150 μm depth from the brain surface) after intravenous injection of PEG1100-grafted silica-shelled QD525 (2.5 nmol/kg bodyweight) in the anesthetized rat. The images were obtained at λex = 810 nm and a mean laser power of about 2.7 W. Detectors: filter/band-pass: 525/50 nm (via a 560/10 nm beam splitter).
Abbreviations: QD, quantum dot; PEG, polyethylene glycol.
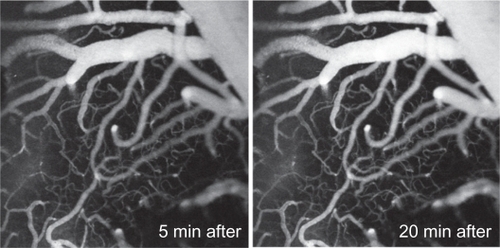
Figure 8 Model structure of PEGylated multimodal silica-shelled quantum dots.Citation48
Note: Reprinted with permission from Zhelev Z, Ohba H, Bakalova R. Single quantum dot-micelles coated with silica shell as potentially non-cytotoxic fluorescent cell tracers. J Am Chem Soc. 2006;128:6324–6325. Copyright 2006 American Chemical Society.
Abbreviations: PEG, polyethylene glycol; DOTA, tetraazacyclododecanetetraacetic acid.
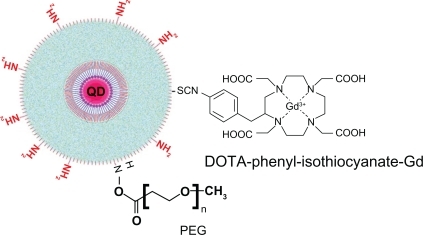
Table 6 Spectral characteristics of PEG1100-grafted multimodal silica-shelled QDs
Figure 9 (A) Fluorescent imaging of tumor by angiogenesis in the anesthetized mouse injected intravenously with PEG1100-grafted multimodal QD655 (1.6 nmol/kg bodyweight, single dose). Dashed lines indicate liver area and tumor area (including angiogenic network). The images were obtained 15 minutes after injection using an IVIS® imaging system, with excitation at 450 ± 30 nm and emission at 650 nm (DsRed filter). The images were obtained on day 10 after inoculation (1 × 10⁵ cells in 10 μL). (B) Fluorescence intensity in tumor area, liver area, and other parts of the body (background fluorescence) after intravenous injection of PEG1100-grafted multimodal QD655 (1.6 nmol/kg bodyweight, single dose). Data were calculated from the images in A.
Abbreviations: QD, quantum dot; PEG, polyethylene glycol.
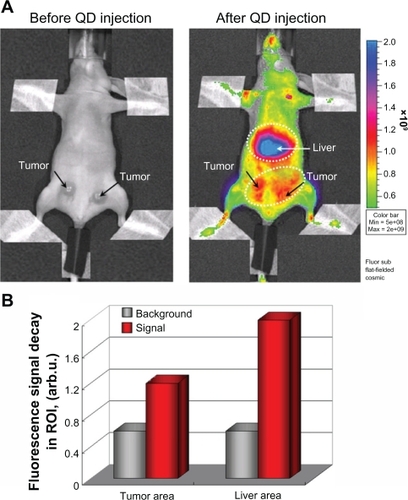
Figure 10 T1-weighted magnetic resonance images of colon cancer in the anesthetized mouse injected intravenously with PEG1100-grafted multimodal QD655 embedded with gadolinium (1 μmol/kg bodyweight, single dose). Dashed lines indicate tumor area (including angiogenic vasculature). The images were obtained immediately after injection, using 7.0 Tesla magnetic resonance imaging. Imaging parameters: spin echo sequence with fat suppression preparation pulse; repetition time 400 msec; echo time 9.574 msec; field of view 32 × 32 mm; matrix size 256 × 256; slice thickness 1.0 mm; number of averages 4.
Abbreviations: QD, quantum dot; PEG, polyethylene glycol.
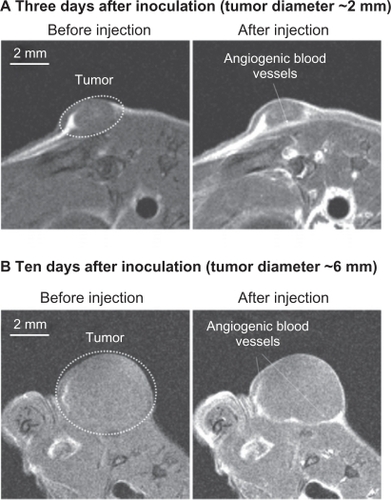
Figure S1 Experimental scheme of imaging of two-photon excited fluorescence in rats.
Abbreviation: QD, quantum dot.
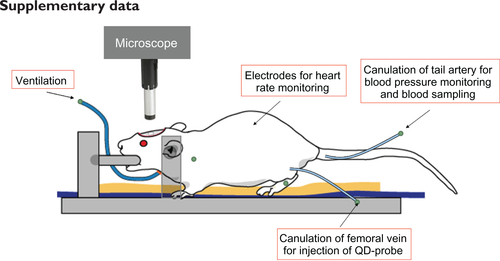
Table S1 Physiological characteristics of rats before and after intravenous injection of polyamidoamine C12 dendrimer 0.1 nmol/kg bodyweight
Table S2 Effect of PAMAM C12 dendrimers on cell viability in vitro (% from control)
Table S3 Effect of water-soluble amino-functionalized CdSe/ZnS QD485 without additional organic shell on cell viability in vitro (% from control)