Figures & data
Figure 1 Poly(d,l-lactide-co-glycolide) hydrolysis.
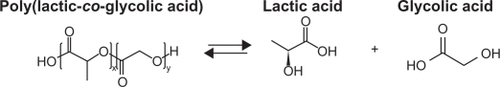
Figure 2 Structures of A) triamcinolone acetonide and B) polyethylene glycol ether.
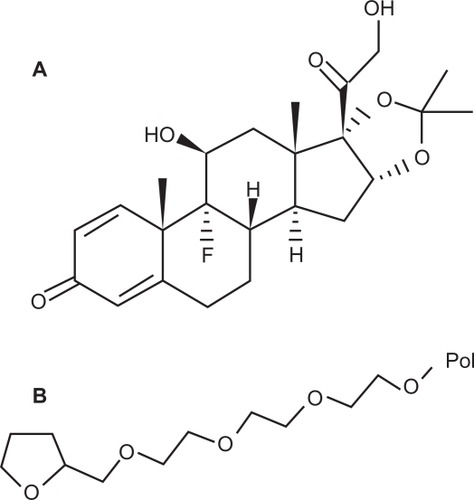
Table 1 Selected parameters and their levels for experimental design
Table 2 L9 orthogonal array
Figure 3 Triamcinolone acetonide release kinetics in poly(d,l-lactide-co-glycolide) in phosphate buffer.
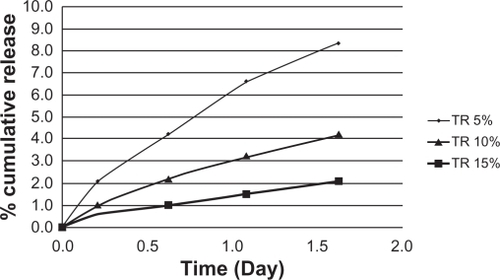
Table 3 Cumulative release after 1.5 days
Figure 4 Hydroxyapatite nanoparticles.
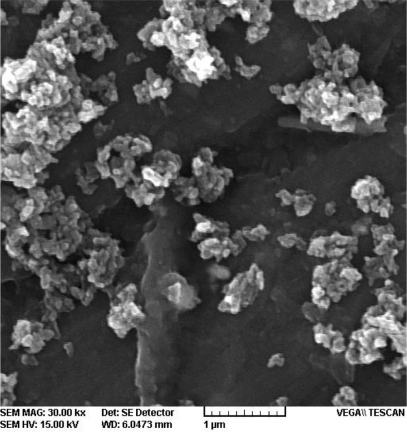
Figure 5 Cumulative triamcinolone acetonide release kinetics in poly(d,l-lactide-co-glycolide)-hydroxyapatite in phosphate buffer.
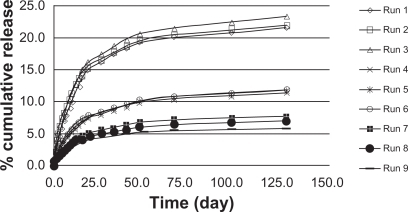
Table 4 ANOVA for cumulative release after 1.5 days
Table 5 Optimum conditions for the burst release reduction
Figure 6 Cumulative TR release kinetics in poly(d,l-lactide-co-glycolide)-hydroxyapatite in phosphate buffer (after 1.5 days).
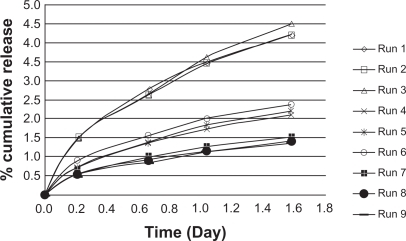
Figure 7 Effects of variables vs parameter levels.
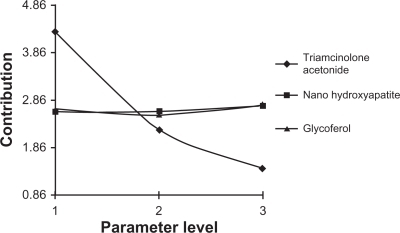
Figure 8 Effects on pH of triamcinolone acetonide (5%) with PLGA or PLGA-HA.
Abbreviations: PGLA, poly(d,l-lactide-co-glycolide); PGLA-HA, poly(d,l-lactide-co-glycolide) with hydroxyapatite.
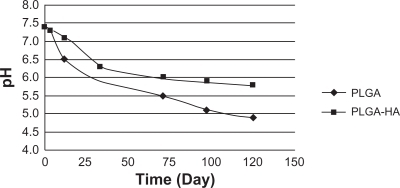
Figure 9 SEM image of membranes after immersion in phosphate buffer for 20 days: A) poly(d,l-lactide-co-glycolide) and B) PGLA-HA: poly(d,l-lactide-co-glycolide) with hydroxyapatite.
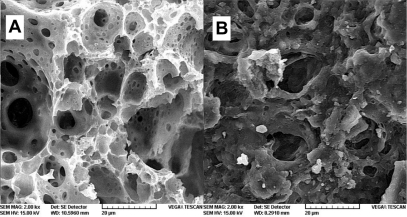
Figure 10 Diffractograms of A) triamcinolone acetonide B) PLGA and triamcinolone acetonide (15%), C) PLGA and triamcinolone acetonide (15%) and polyethylene glycol ether (3%).
Abbreviation: PLGA, poly(D,L-lactide-co-glycolide).
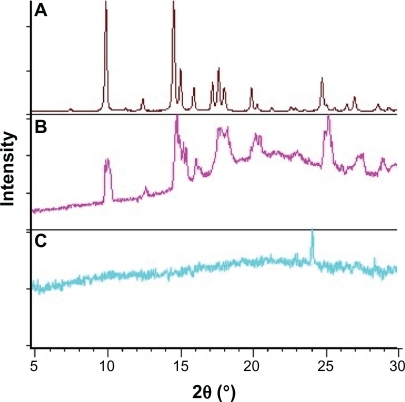
Figure 11 Scanning electron microgram of poly(d,l-lactide-co-glycolide) membranes: A) 3% and B) 0% polyethylene glycol ether.
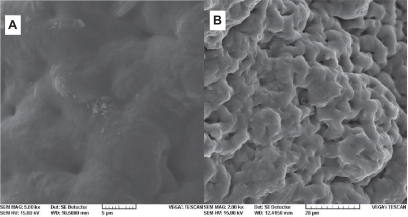
Figure 12 Fourier transform near infrared spectra of poly(d,l-lactide-co-glycolide) membranes in the presence of A) 0%, B) 1%, and C) 3% polyethylene glycol ether.
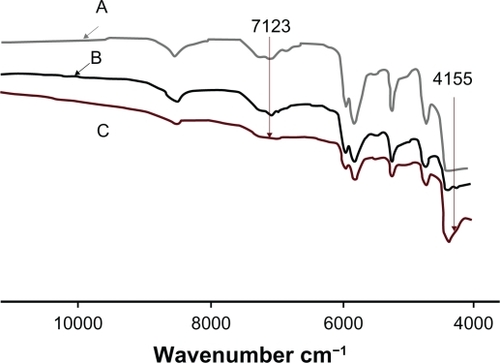
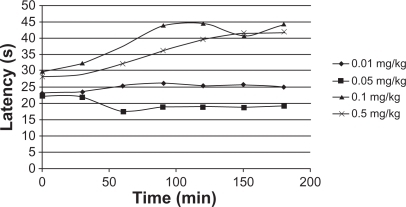
Figure 13 Hot-plate response of mice (n = 5) administered triamcinolone acetonide.
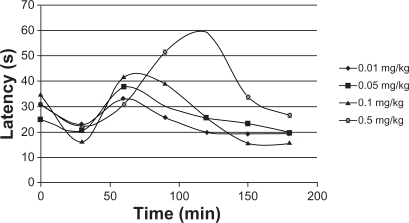
Figure 14 Hot-plate response of mice (n = 5) administered triamcinolone acetonide with poly(d,l-lactide-co-glycolide).