Figures & data
Figure 1 Schematic diagram of synthesis of NBs-GPC3-rGO constructed for rGO targeted delivery and photothermal therapy.
Abbreviations: DSPC, 1, 2-distearoyl-sn-glycero-3-phosphocholine, DSPE-PEG2000, 1, 2-distearoyl-sn-glycero-3-phosphoethanolamine-N-[methoxy(polyethylene glycol)-2000]; DSPE-PEG2000-biotin, 1, 2-distearoyl-sn-glycero-3-phosphoethanolamine-N-[biotinyl (polyethylene glycol)-2000)]; GPC3, heparin sulfate proteoglycan glypican-3; UTND, ultrasound-targeted nanobubbles destruction.
![Figure 1 Schematic diagram of synthesis of NBs-GPC3-rGO constructed for rGO targeted delivery and photothermal therapy.Abbreviations: DSPC, 1, 2-distearoyl-sn-glycero-3-phosphocholine, DSPE-PEG2000, 1, 2-distearoyl-sn-glycero-3-phosphoethanolamine-N-[methoxy(polyethylene glycol)-2000]; DSPE-PEG2000-biotin, 1, 2-distearoyl-sn-glycero-3-phosphoethanolamine-N-[biotinyl (polyethylene glycol)-2000)]; GPC3, heparin sulfate proteoglycan glypican-3; UTND, ultrasound-targeted nanobubbles destruction.](/cms/asset/f6451c27-63a2-4704-a865-5d4e352cdb5f/dijn_a_12194290_f0001_c.jpg)
Figure 2 Characterization of nanobubbles, proof the chains are convelent together.
Notes: Bar in A–C is 10 µm, inset in , bar=100 nm, bar in G and H=4 µm, bar in I=0.6 µm. (A) Nanobubbles (NBs) in suspension were milk white in color. Pure NB solution was observed under a light microscope (magnification, 1,000×). (B) Avidinylated nanobubbles were observed under a light microscope (magnification, 1,000×). (C) Nanobubbles conjugated with FITC-labeled avidin under fluorescence microscopy (magnification, 1,000×). The surface of nanobubbles appeared green under fluorescence microscopy, indicating that FITC-labeled avidin was packaged on the NB surface. (D) Fourier transform infrared (FTIR) spectra of graphene oxide-polyethylene glycol (GO-PEG) and reduced graphene oxide (rGO)-PEG. The GO-PEG and rGO-PEG sample was filtered over three times through a 100 kDa molecular weight cutoff (MWCO) filter to completely remove any unconjugated PEG (10 kDa). (E) A UV-vis-near-infrared (NIR) spectrum of nano-rGO-PEG-GPC3-cy7 and free cy7 dye solution. (F) Binding efficiency of biotinylated FITC-labeled rGO-PEG-GPC3 with avidinylated NBs was determined by flow cytometry. Comparison of the fluorescence intensities for NBs (black line, control) and FITC-labeled NBs-GPC3-rGO (red line) implies successful binding of rGO-PEG-GPC3 with avidinylated NBs. (G) Scanning electron microscopy revealed normal surface morphology of the Hep G2 cells (4,000×). Under scanning electron microscopy, targeted NBs-GPC3-rGO were clustered on the surface of the Hep G2 cells (H and I, 4,000× and 10,000×, respectively).
Abbreviation: GPC3, heparin sulfate proteoglycan glypican-3.
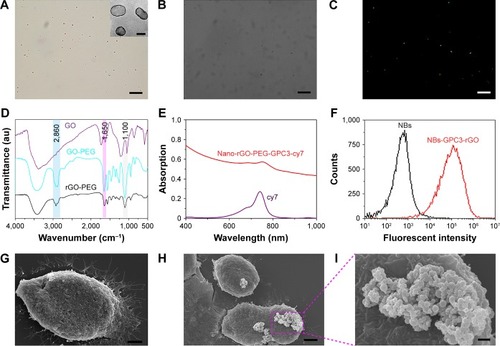
Figure 3 Characterization of reduced graphene oxide (rGO) sheets. (A) An AFM image of reduced nanographene oxide (nano-rGO). The image is on a 10 nm height scale. (B) A UV-vis-near-infrared (NIR) spectrum of nano-GO-polyethylene glycol (PEG) and nano-rGO-PEG solution. (C) Photothermal heating curves of the nano-rGO-PEG and nano-GO-PEG solutions and the deionized water (DIW) exposed to the 808 nm laser at a power density of 2 W/cm2. Black curve is 1 mL of solutions with 20 mg/L concentration of nano-rGO-PEG, red curve is nano-GO-PEG and dark blue curve is DIW.
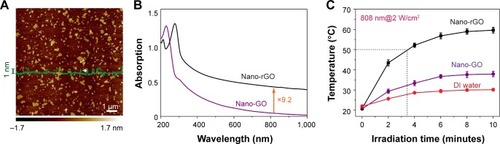
Figure 4 Quantitative growth inhibition assay in HepG2 cells after different treatments.
Notes: (A) Ultrasound-targeted destruction of nanobubbles (NBs)-GPC3-reduced graphene oxide (rGO), compared with Blank group, and avidinylated NBs. (B) Cellular viability data based on Cell Counting Kit-8 (CCK-8) for Hep G2 cells incubated for 48 hours with PEGylated nano-rGO. (C) Absorption spectra of the 1, 3-diphenylisobenzofuran (DPBF) probe under different irradiation times. (D) Cellular viability effect of Hep G2 cells with different treatments. The viability rate of cells was determined by CCK-8 assay at 24, 48 and 72 hours after different treatments. Data are represented as mean ± SD (n=7). The cell viability rate of the NBs-GPC3-rGO + laser (group 6) and the NBs-GPC3-rGO + ultrasound-targeted NB destruction (UTND) + laser (group 7) are significantly lower than those of the other groups (P<0.05).
Abbreviations: DPBF, 1, 3-diphenylisobenzofuran; GPC3, heparin sulfate proteoglycan glypican-3.
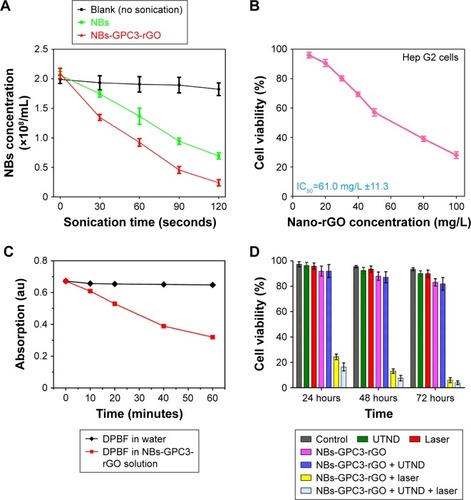
Figure S1 Average particle size of NBs (A and D), Avidinylated NBs (B and E) and NBs-GPC3-rGO (C and F) determined by dynamic light scattering (DLS) analysis. The three curves (D–F) of average particle size were analyzed by Shapiro-Wilk test to explain that all three groups of data followed a Gaussian distribution.
Abbreviations: GPC3, heparin sulfate proteoglycan glypican-3; NBs, nanobubbles; rGO, reduced graphene oxide.
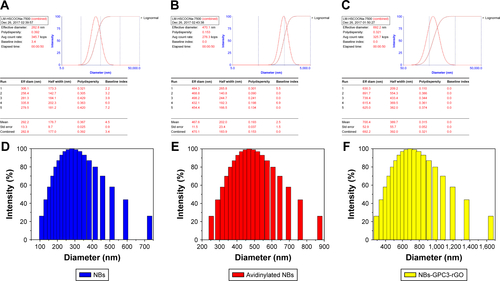
Figure S2 Raman spectroscopy was performed at room temperature using a Raman Microprobe (LabRAM HR800; Horiba Scientific, Jobin-Yvon, France).
Note: The ID/IG ratio of nano-rGO did increase notably, indicating that the reduction process altered the structure of G-O with a high quantity of structural defects.
Abbreviations: GO, graphene oxide; rGO, reduced graphene oxide.
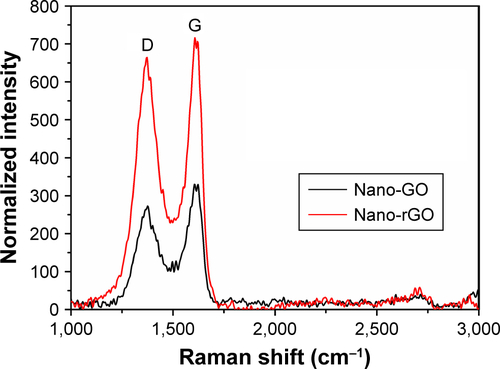
Figure S3 XRD patterns of nano-GO-PEG and nano-rGO-PEG.
Abbreviations: GO, graphene oxide; r-GO, reduced graphene oxide; XRD, X-ray diffraction.
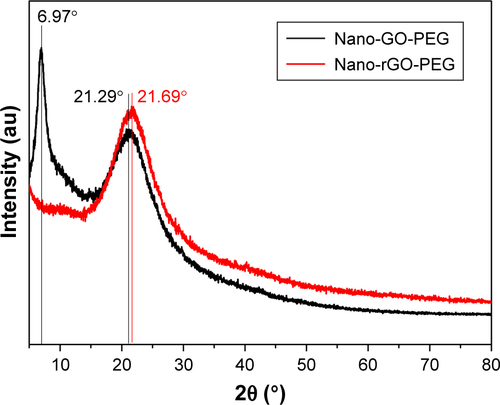
Figure S4 The zeta potential of the NBs (A) and NBs-GPC3-rGO (B) solution were determined by dynamic light scattering (DLS) measurements.
Abbreviations: GPC3, heparin sulfate proteoglycan glypican-3; NBs, nanobubbles; rGO, reduced graphene graphite.
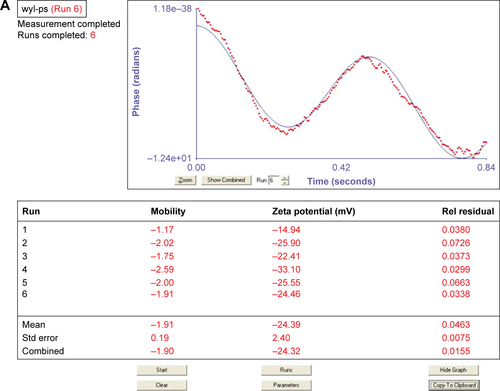
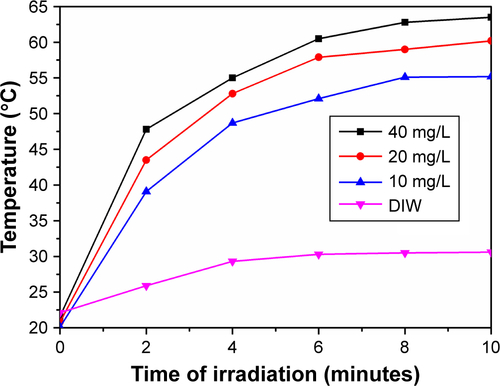
Figure S5 Photothermal heating curves of nano-rGO solutions.
Note: The rise in temperature plots of various concentration of nano-rGO and deionized water (DIW), nano-GO (20 mg/mL) and nano-rGO (20 mg/mL) at 808 nm at 2 W/cm2 NIR.
Abbreviations: rGO, reduced graphene graphite; NIR, near infrared.