Figures & data
Table 1 Composition of mixtures used for film preparation (w/v%)
Figure 1 (A) Schematic illustrations of the fabrication of the nanoscale dual drug delivery system (SP-Ms/SB-Ms-loaded nanofiber) via electrospinning process. The morphology and size distribution of SP600125-loaded micelles and SB203580-loaded micelles are shown. (B) SP600125-loaded micelles TEM image (inset is the magnified image). (C) SB203580-loaded micelles TEM image (inset is the magnified image). (D, E) The corresponding diameter distributions of SP600125-loaded micelles (D) and SB203580-loaded micelles (E). Scale bar (insets) =50 nm. The morphology and diameter distribution of micelles-loaded composite nanofibers. (F) SEM images of S0, S1, S2, and S3 samples (insets are the magnified images). Scale bar =10 µm and the inserts bars =2 µm. (G) The corresponding TEM images of S0, S1, S2, and S3 samples. Scale bar =1 µm. (H) CLSM images of the electrospun SP600125-Ms/SB203580-Ms nanofibers. The images from left to right show the bright field, emission of the SP600125-Ms-loaded nanofibers, emission of the SB203580-Ms-loaded nanofibers, and an overlaid representation of all components, respectively. Scale bar =50 µm.
Abbreviations: CLSM, confocal laser scanning microcopy; S, solution; SB, SB203580; SB-Ms, SB203580-micelles; SEM, scanning electron microscope; SP, SP600125; SP-Ms, SP600125-micelles; TEM, transmission electron microscope.
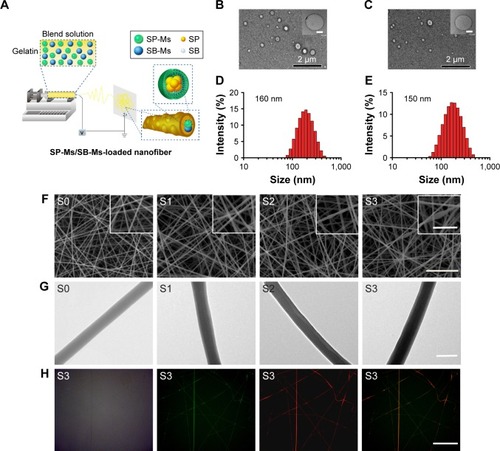
Table 2 Primer sequences for qPCR (GAPDH was used as a calibrator)
Figure 2 (A) Cumulative release profiles of SP600125 from S1 and S3 nanofibrous mats. (B) Cumulative release profiles of SB203580 from S2 and S3 nanofibrous mats. (C) Identification of cells. Primary cultured human PDL fibroblasts were identified by immunofluorescence staining using antibodies specific for the fibroblast protein maker vimentin and for the epithelial protein maker cytokeratin followed by secondary antibody (red). (D) CCK-8 assay of HPDLCs proliferation on S0, S1, S2, S3 scaffolds and on TCP as control after 1, 3, 5, and 7 days of culture. *P<0.05 compared to the corresponding controls.
Abbreviations: CCK-8, Cell Counting Kit-8; HPDLCs, human periodontal ligament cells; PDL, periodontal ligament cell; S, solution; TCP, tissue culture polystyrene.
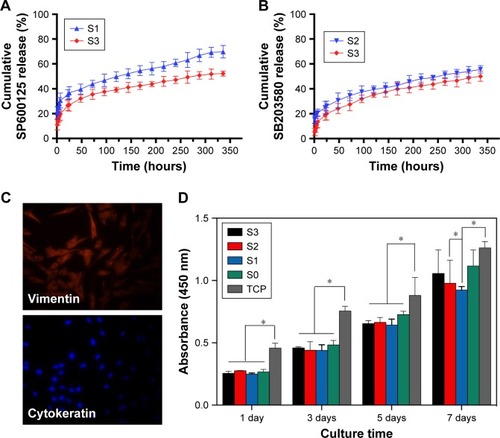
Figure 3 Confocal laser scanning microscopy images of HPDLCs on S0, S1, S2, and S3 scaffolds for 7 days.
Notes: Red, blue, and green fluorescence represent the 549-conjugated anti-rat IgG antibody for MMP-2, DAPI-stained cell nuclei, and the Alexa Flour@488 phalloidin-stained actin, respectively. Scale bar =50 µm.
Abbreviations: HPDLCs, human periodontal ligament cells; S, solution; TCP, tissue culture polystyrene.
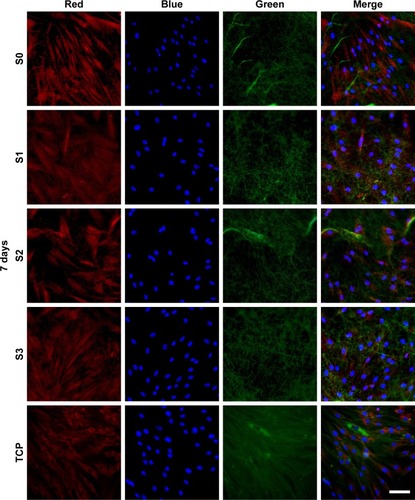
Figure 4 LPS-induced MMP-2 and MMP-13 expression.
Notes: (A) Different LPS concentrations induce MMP-2 mRNA. *P<0.05, significant difference as compared with the LPS 0 µg/mL. (B) Different LPS concentrations induce MMP-13 mRNA. Effects of S0, S1, S2, and S3 scaffolds on the expression MMP-2 and MMP-13 stimulated by LPS (5 µg/mL). (C, D) Cells were incubated with LPS for 8 hours, and the expression levels of MMP-2 and MMP-13 mRNAs were determined using real-time PCR. (E, F) Cells were incubated with LPS for 24 hours, and MMP-2 (E) and MMP-13 (F) protein levels in supernatant were assayed by Western blot. The data represent mean ± SD of three independent experiments. (G) Dual drug delivery system (SP-Ms/SB-Ms-loaded nanofiber) regulates matrix degradation and bone resorption in periodontal environment. *P<0.05, significant difference as compared with the S0 and **P<0.05, significant difference as compared with the LPS+S0.
Abbreviations: ECM, extracelluar matrix; LPS, lipopolysaccharide; PMN, polymorphonuclearleucocyte; S, solution; SB, SB203580; SB-Ms, SB203580-micelles; SP, SP600125; SP-Ms, SP600125-micelles.
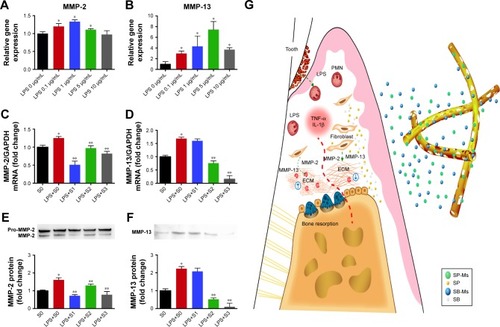
Figure 5 Sequence of in vivo procedures.
Notes: (A) Mucoperiosteal flaps were elevated to expose periodontal buccal bone walls. (B) The defects were having the following dimensions: 5 mm apicocoronally, 5 mm mesiodistally, and 3 mm buccolingually. (C) After scaling periodontal ligament scales and debris from defects, an impression material (Impregum Soft™, 3M) was completely filled in the defects. (D) The defects were covered by biomaterials and the mucoperiosteal flaps were restored. (E) ROI was used in analysis of alveolar bone. (F–J) Histology of bone regeneration in class II furcation defects at 8 weeks. (F) The control group. (G) The S0 group with BMP-2. (H) The S1 group with BMP-2. (I) The S2 group with BMP-2. (J) The S3 group with BMP-2. Scale bar =500 µm.
Abbreviations: CTi, connective tissue; NB, new bone; PB, pre-existing bone; ROI, region of interest; S, solution.
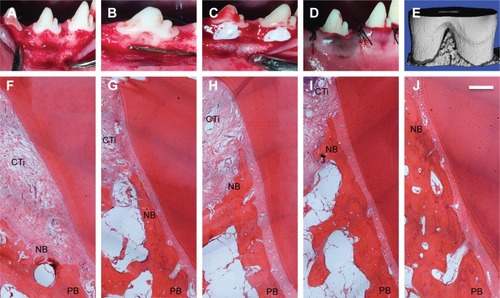
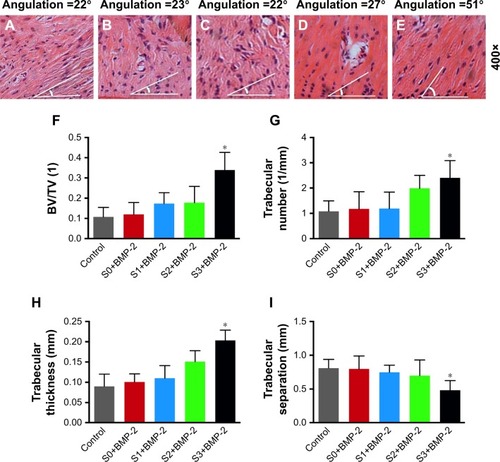
Figure 6 Histology of the periodontal defects at 8 weeks post-surgery.
Notes: (A–E) The angle represents the angulation of regenerated ligament direction of each representative image: (A) the control group, (B) the S0 group with BMP-2, (C) the S1 group with BMP-2, (D) the S2 group with BMP-2, and (E) the S3 group with BMP-2. Scale bar =50 µm. (F–I) Micro-CT images: (F) bone volume per total volume (BV/TV), (G) trabecular number, (H) trabecular thickness, and (I) trabecular separation of various groups. *P<0.05 compared with control.
Abbreviations: Micro-CT, microcomputed tomography; S, solution.