Figures & data
Figure 1 Effect of treatment duration and Ver on cytotoxicity of 1 µM Ptx delivered in various vehicles in MCF7 and MCF7/ADR (ADR) cells. Notes: (A) MCF7 without Ver; (B) MCF7/ADR without Ver; (C) MCF7 with Ver; and (D) MCF7/ADR with Ver.
Abbreviations: Ver, verapamil; Ptx, paclitaxel; DMSO, dimethyl sulfoxide; Cre, Cremophor EL; E, ethanol; SLNs, solid lipid nanoparticles.
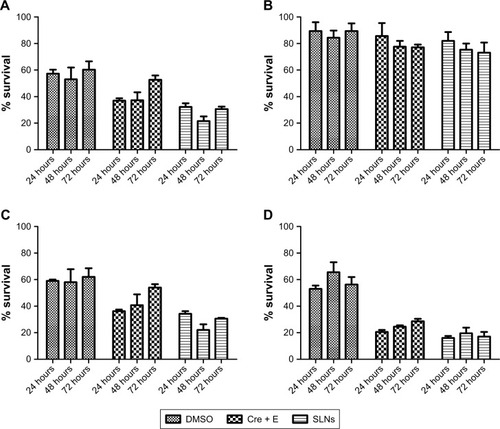
Table 1 IC50 (nM) values of Ptx loaded in various vehicles against MCF7 and MCF7/ADR with and without Ver
Figure 2 Concentration-dependent cytotoxicity of Ptx delivered using various vehicles in MCF7 and MCF7/ADR (ADR) cells in the absence (A and B) and presence (C and D) of Ver.
Abbreviations: Ptx, paclitaxel; Ver, verapamil; DMSO, dimethyl sulfoxide; Cre, Cremophor EL; E, ethanol; SLNs, solid lipid nanoparticles.
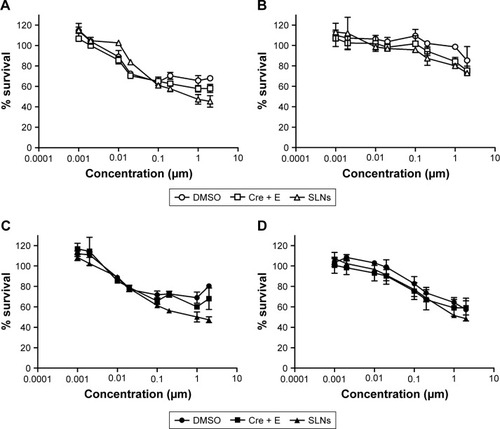
Figure 3 Intracellular uptake of Ptx delivered using various vehicles in MCF7 (A) and MCF7/ADR (B) cells in the absence or presence of Ver.
Note: *Significantly different compared to control (P<0.05).
Abbreviations: Ptx, paclitaxel; Ver, verapamil; DMSO, dimethyl sulfoxide; Cre, Cremophor EL; E, ethanol; SLNs, solid lipid nanoparticles.
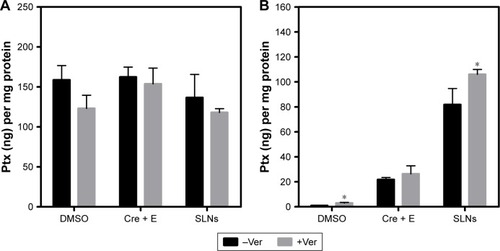
Figure 4 Confocal laser-scanning microscopy of internalization of Rho (red) in MCF7 (A) and MCF7/ADR (B) cells.
Notes: Cells were treated with 0.4 µM Rho in DMSO (Rho/DMSO) or SLNs (Rho-SLNs) for 2 hours. Controls were untreated cells. Cell nuclei were stained with DAPI (blue).
Abbreviations: Rho, rhodamine 123; DMSO, dimethyl sulfoxide; SLNs, solid lipid nanoparticles.
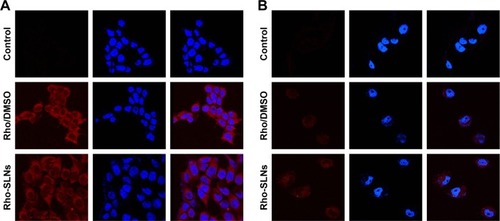
Figure 5 Effect of Ver, a Pgp inhibitor, on cellular uptake of Rho-SLNs (red) in MCF7 (A) and MCF7/ADR (B) cells.
Notes: Cells were pretreated with 20 µM Ver for 30 minutes and then treated with 0.4 µM Rho incorporated in SLNs (Rho-SLNs) for 2 hours. Controls were untreated cells. Cell nuclei were stained with DAPI (blue).
Abbreviations: Ver, verapamil; Rho, rhodamine 123; SLNs, solid lipid nanoparticles.
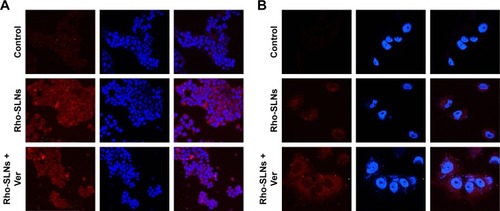
Figure 6 Western blot for expression of Pgp, clathrin, and caveolin 1 in MCF7 and MCF7/ADR cells.
Note: MDCK cell line was used as a positive control for caveolin 1 expression.
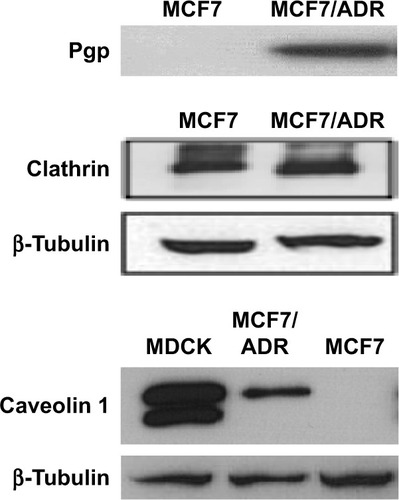
Figure 7 Effects of endocytosis inhibitors on the Pgp-mediated efflux of Rho in MCF7/ADR cells.
Notes: Intracellular Rho level expressed as percentage of fluorescence intensity compared to control cells, which were treated only with Rho in the absence of other agents. *Significantly different compared to control (P<0.05).
Abbreviations: Rho, rhodamine 123; Ver, verapamil; Gen, genistein; Cpz, chlorpromazine.
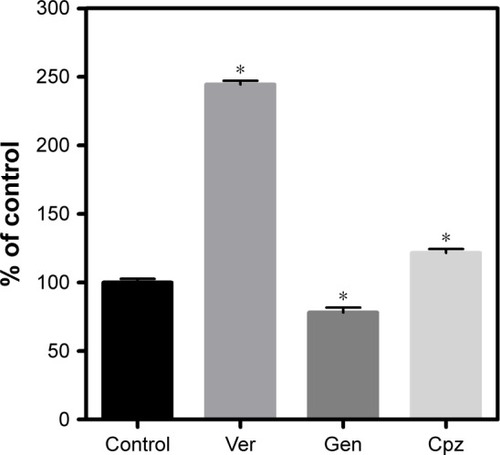
Figure 8 Effects of endocytosis inhibition by lowered temperature.
Notes: (A) 37°C vs 4°C, (B) Gen, and (C) Cpz on uptake of Ptx-SLNs in MCF7 and MCF7/ADR cells. All cells were treated concomitantly with Ver to eliminate the effect of Pgp-mediated efflux on Ptx uptake. *Significantly different compared to without endocytosis inhibitor in each cell line (P<0.05).
Abbreviations: Gen, genistein; Cpz, chlorpromazine; Ptx, paclitaxel; Ver, verapamil; SLNs, solid lipid nanoparticles.
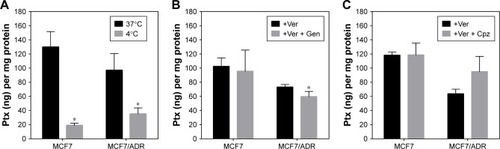
Table 2 Mean particle size and PI of SLNs prepared using sonication and HPH
Figure 9 Effects of endocytosis inhibition by Gen and Cpz on uptake of Rho-SLNs in MCF7 (A) and MCF7/ADR (B) cells.
Notes: All cells treated concomitantly with Ver to eliminate the effect of Pgp-mediated efflux on Rho uptake. *Significantly different compared to endocytosis inhibitor in each cell line (P<0.05).
Abbreviations: Gen, genistein; Cpz, chlorpromazine; Rho, rhodamine 123; SLNs, solid lipid nanoparticles; Ver, verapamil.
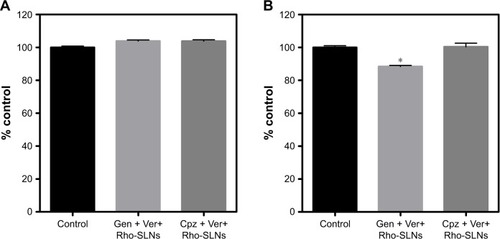
Figure 10 Effects of endocytosis inhibition by Gen and Cpz on Rho-SLN uptake with smaller mean particle size after HPH in MCF7 (A) and MCF7/ADR (B) cells.
Notes: All cells were treated concomitantly with Ver to eliminate the effect of Pgp-mediated efflux on Rho uptake. *Significantly different compared to without endocytosis inhibitor in each cell line (P<0.05).
Abbreviations: Gen, genistein; Cpz, chlorpromazine; Ver, verapamil; Rho, rhodamine 123; SLNs, solid lipid nanoparticles; HPH, high-pressure homogenization.
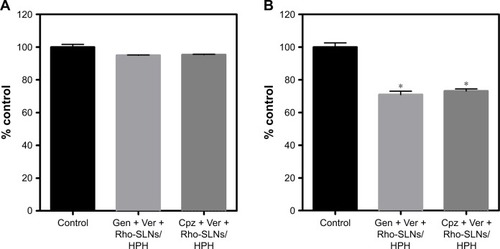
Figure 11 Confocal laser-scanning microscopy micrographs of internalization of Rho-SLNs (red) in MCF7 (A) and MCF7/ADR (B) cells.
Notes: Endocytosis of cells was inhibited by 200 µM Gen or 10 µg/mL Cpz. All cells were treated concomitantly with Ver to eliminate the effect of Pgp-mediated efflux on Rho uptake. Cell nuclei were stained with DAPI (blue).
Abbreviations: Rho, rhodamine 123; SLNs, solid lipid nanoparticles; Gen, genistein; Cpz, chlorpromazine; Ver, verapamil.
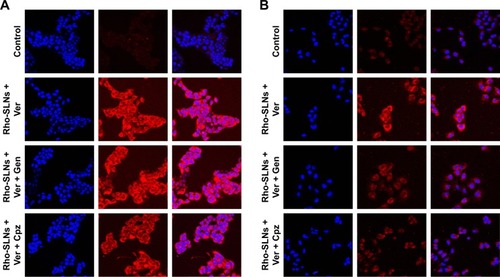
Figure 12 Effect of Cpz on intracellular uptake of hTf (green), known as a ligand for clathrin-mediated endocytosis in MCF7 (A) and MCF7/ADR (B) cells.
Note: Cell nuclei were stained with DAPI (blue).
Abbreviations: Cpz, chlorpromazine; hTf, human serum transferrin.
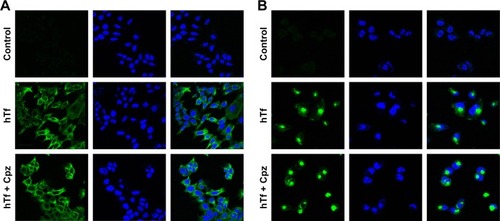
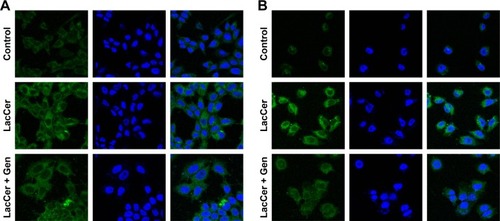
Figure 13 Effect of Gen on intracellular uptake of LacCer (green), known as a ligand for caveola-mediated endocytosis in MCF7 (A) and MCF7/ADR (B) cells. Note: Cell nuclei were stained with DAPI (blue).
Abbreviation: Gen, genistein.