Figures & data
Table 1 Lattice constants a, b, and c for ZnO nanoparticles before and after ball milling for different times
Figure 1 X-ray diffracted peaks of ZnO nanoparticles before and after ball milled for different times.
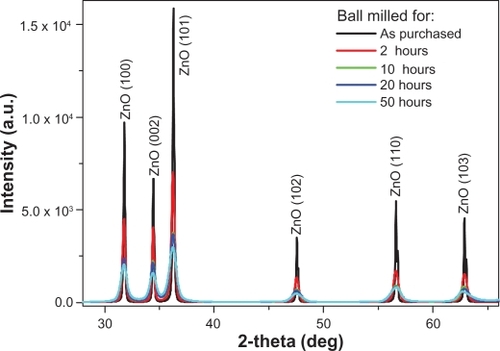
Figure 2 The value of the lattice constant c as a function of milling time.
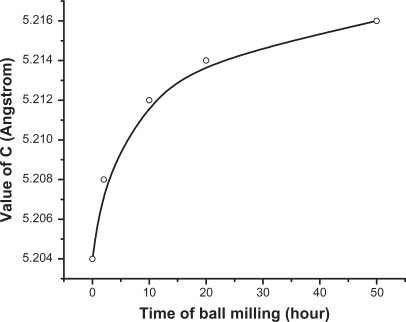
Figure 3 Scanning electron microscope images of ZnO samples before and after milling: (A1) as purchased. (B1, C1, D1, and E1) for the samples ball milled for 2, 10, 20, and 50 hours respectively.
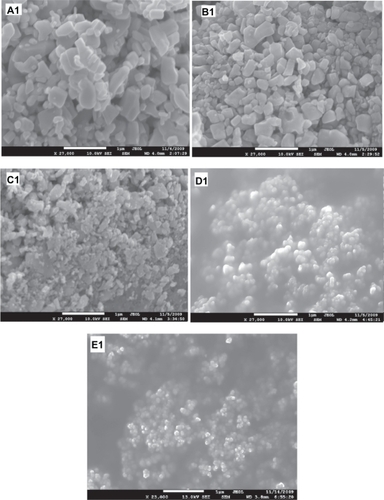
Figure 4 Particle size as a function of milling time.
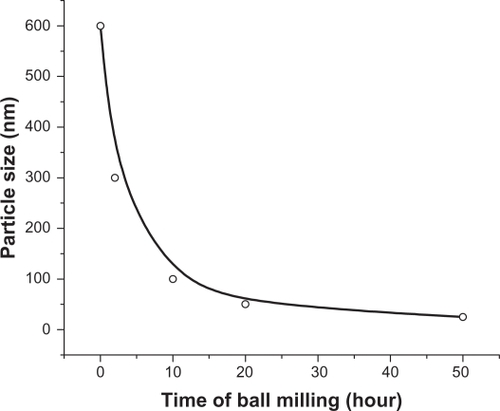
Figure 5 Transmission electron microscope images of ZnO samples before and after milling; (A2) as purchased (B2, C2, D2 and E2) for the samples ball milled for 2, 10, 20, and 50 hours respectively.
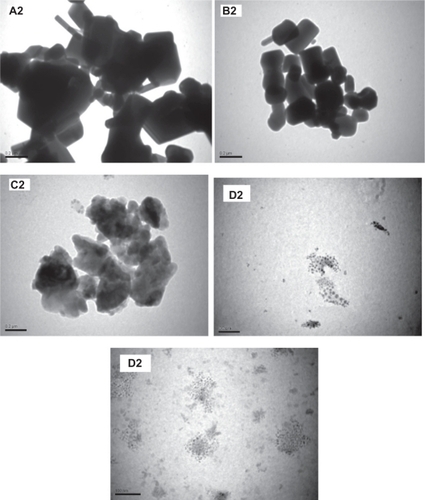
Figure 6 Photoluminescence emission spectra of ZnO nanocrystalline samples prepared by ball milling at different times. The excitation wavelength is 325 nm.
Abbreviation: PL, photoluminescence.
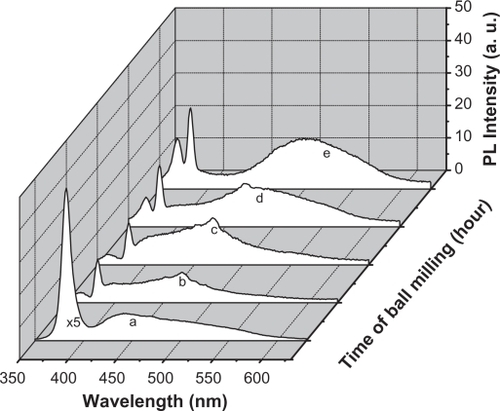
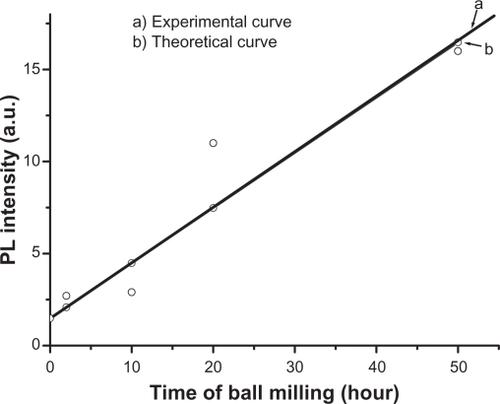
Figure 7 Photoluminescence intensity of the peak at 365 nm as a function of milling time (size of ZnO nanoparticles): (a) experimental curve, (b) theoretical curve.
Abbreviation: PL, photoluminescence.