Figures & data
Figure 1 Formation of the carbon nanotube–chitosan complex.
Notes: Transmission electron microscope imaging demonstrated the formation of an interweaving network of chitosan polymer with carbon nanotubes. (A) 1% C-SWCNT; (B) 5% C-SWCNT; (C) 1% C-MWCNT; (D) 5% C-MWCNT.
Abbreviations: C-SWCNT, chitosan–single-wall carbon nanotube; C-MWCNT, chitosan–multi-wall carbon nanotube.
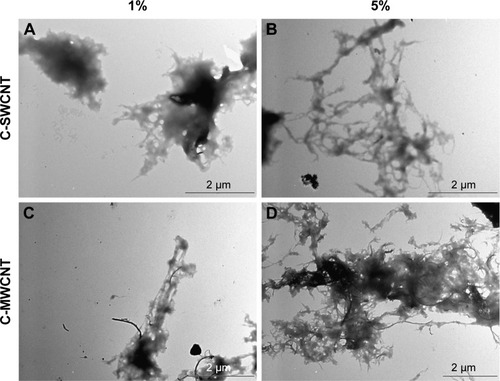
Figure 2 Fibroblasts formed ECT in vitro in the presence of C-SWCNTs and C-MWCNTs.
Notes: (A, E, I) Bright-field images for intact ECT; (B, F, J) actin cytoskeleton of the fibroblasts stained with TRITC-phalloidin (red); (C, G, K) nuclei stained with DAPI (blue); (D, H, L) merged images from DAPI and TRITC-phalloidin.
Abbreviations: ECT, engineered connective tissue; C-SWCNT, chitosan–single-wall carbon nanotube; C-MWCNT, chitosan–multi-wall carbon nanotube; TRITC, tetra-methylrhodamine.
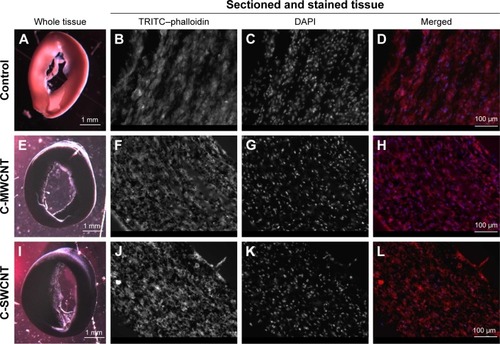
Figure 3 Macroscopic evaluation of the wounds at the end of the 9-day treatment course.
Notes: (A, C, E, G, I) Healing of the internal controls for each of the treatment conditions; (B) following treatment with chitosan; (D) following treatment with 1% C-SWCNT; (F) following treatment with 5% C-SWCNT; (H) following treatment with 1% C-MWCNT; (J) following treatment with 5% C-MWCNT; (K) clinical scoring for the healing wounds at the end of the treatment course with the different conditions. Wounds treated with 1% C-SWCNT and 5% C-MWCNT hydrogel closed more rapidly than the corresponding internal controls. Each tick corresponds to 1 mm (n=5).
Abbreviations: C-SWCNT, chitosan–single-wall carbon nanotube; C-MWCNT, chitosan–multi-wall carbon nanotube.
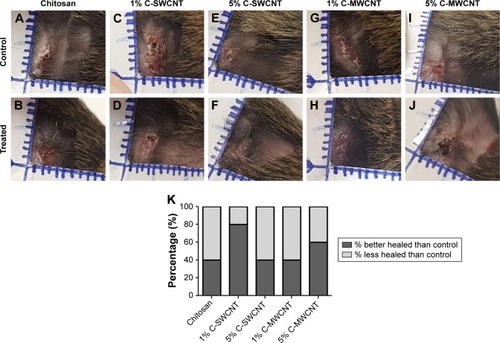
Figure 4 Treatment with 5% C-SWCNTs and 5% C-MWCNTs may increase the percentage of wounds with more fibrosis and more inflammation.
Notes: (A) Percentage of wounds with more/less fibrosis than the corresponding control; (B) percentage of wounds with more/less inflammation than the corresponding control (n=5).
Abbreviations: C-SWCNT, chitosan–single-wall carbon nanotube; C-MWCNT, chitosan–multi-wall carbon nanotube; inflam., inflammation.
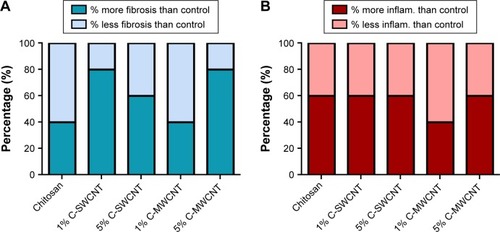
Figure 5 Treatment with 5% C-MWCNTs best improved the fibrotic processes in healing wounds.
Notes: Masson’s trichrome stain for sectioned full-thickness skin tissue samples collected from the site of the healing wounds at the end of the 9-day treatment course. The bluish-green color represents the stained collagen. Magnification 100×. (A, C, E, G, I) Internal controls of the corresponding treatment conditions; (B) following treatment with chitosan; (D) following treatment with 1% C-SWCNTs; (F) following treatment with 5% C-SWCNTs; (H) following treatment with 1% C-MWCNTs; (J) following treatment with 5% C-MWCNTs.
Abbreviations: C-SWCNT, chitosan–single-wall carbon nanotube; C-MWCNT, chitosan–multi-wall carbon nanotube.
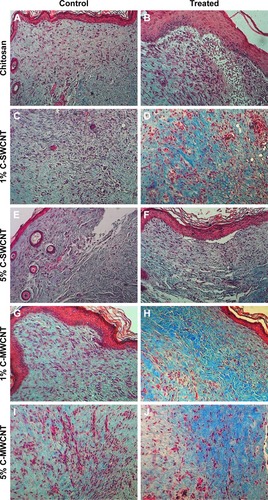
Figure 6 C-MWCNT was the most effective treatment to increase the amount of deposited collagen in the healing wound.
Notes: Images for tissue samples stained with Masson’s trichrome stain were digitally analyzed by the “color deconvolution” plugin in ImageJ. (A) Treatment with chitosan; (B) treatment with 1% C-SWCNTs; (C) treatment with 5% C-SWCNTs; (D) treatment with 1% C-MWCNTs; (E) treatment with 5% C-MWCNTs. Values are given as means ± SEM, n=5, triplicates. *P<0.05 compared to the control. Treatment with 5% C-MWCNTs had a significantly greater effect than that of the corresponding internal control. For the other treatment conditions there was no significant difference.
Abbreviations: C-SWCNT, chitosan–single-wall carbon nanotube; C-MWCNT, chitosan–multi-wall carbon nanotube.
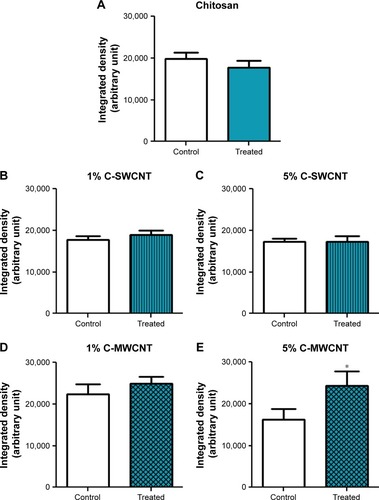
Figure 7 Both MWCNTs and SWCNTs improved the formation of the epithelial layer.
Notes: Representative random images for tissue samples stained with Masson’s trichrome stain were analyzed by ImageJ software, where the “straight line” tool was employed to arbitrarily measure the thickness of the epidermis. Values are given as means ± SEM, n=5, triplicates. *P<0.05 compared to the control.
Abbreviations: C-SWCNT, chitosan–single-wall carbon nanotube; C-MWCNT, chitosan–multi-wall carbon nanotube.
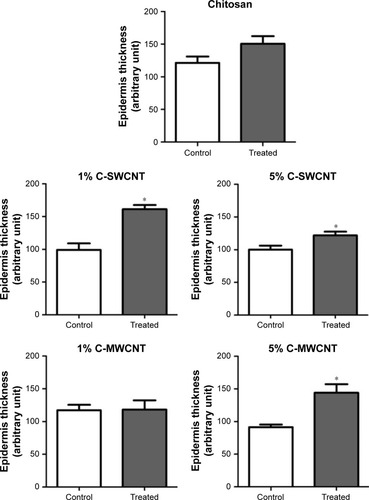
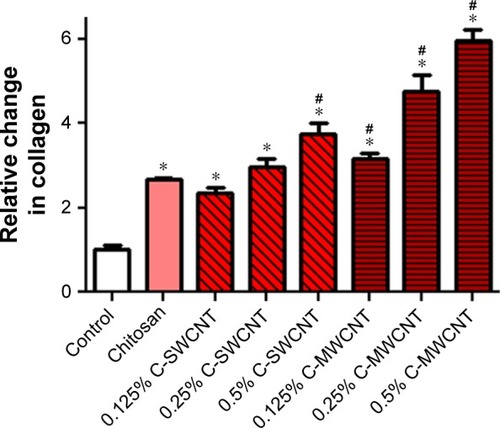
Figure 8 Both C-SWCNTs and C-MWCNTs induced collagen deposition in a concentration-dependent manner.
Notes: The potency was greater with C-MWCNT treatment. Values are given as means ± SEM, n=3. *P<0.05 compared to control; #P<0.05 compared to chitosan.
Abbreviations: C-SWCNT, chitosan–single-wall carbon nanotube; C-MWCNT, chitosan–multi-wall carbon nanotube.